![]()
![]()
************************************************************************************************************************
젨젨쟕he S&P Is Rolling Over
젨젨잺haos Clinic for 9/27/2019
************************************************************************************************************************
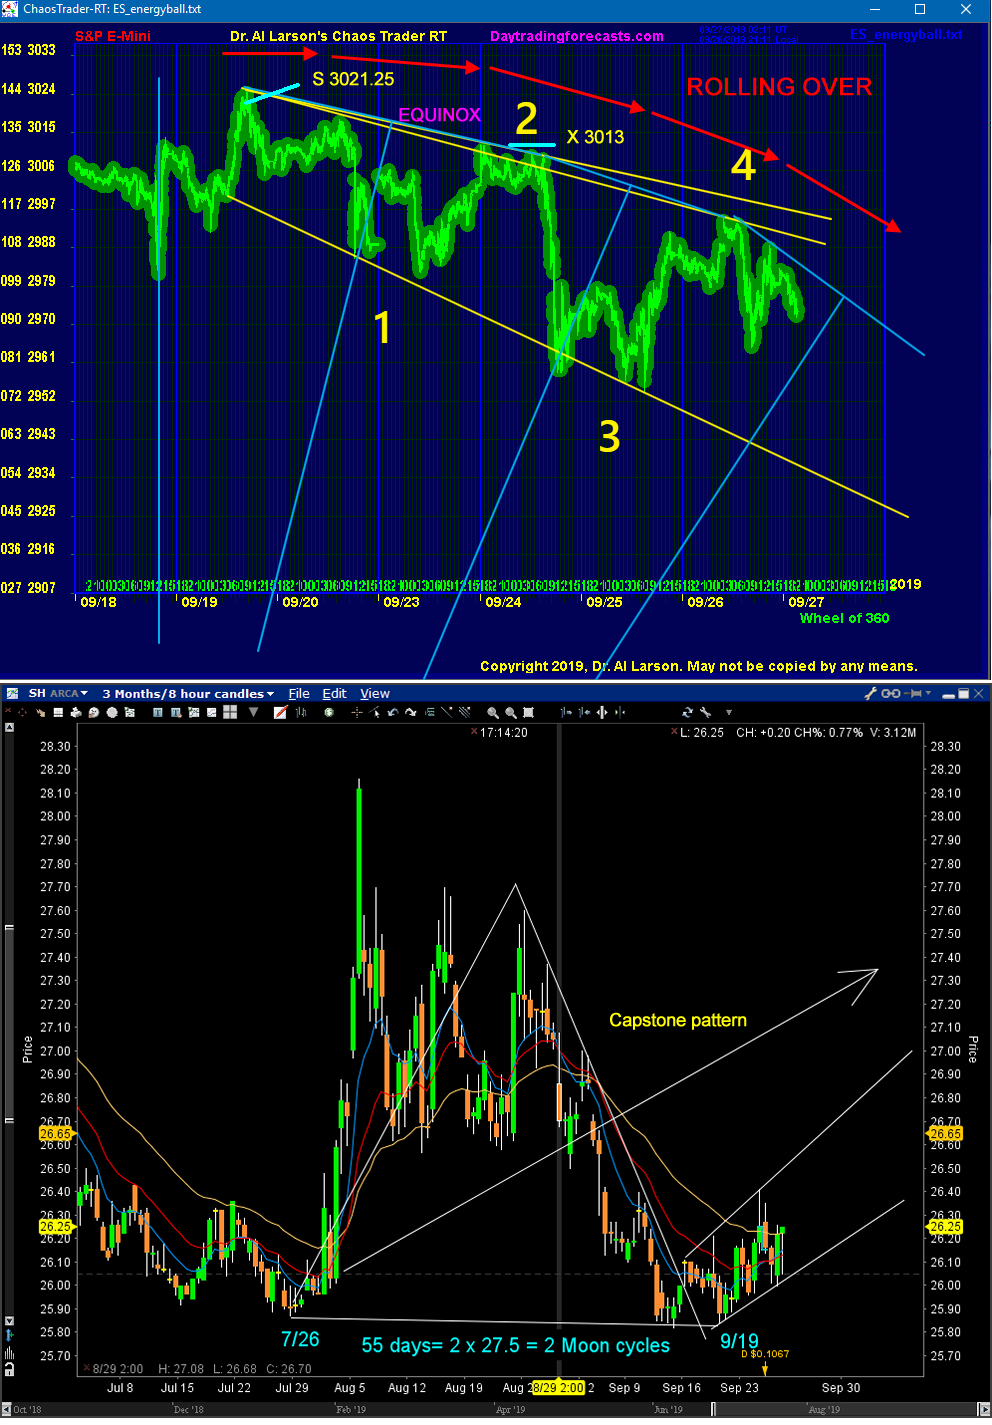
Last week's Chaos Clinic, done before Friday's open, pointed out that the S&P had made
four tests of 3025, indicating a stall in the rally. I pointed out a swing trade sell at 3021.5 that
looked promising. By Friday's close, the market had dropped sharply, suggesting the swing trade might work.
A week later, after the close on September 26th, the market looks to be rolling over in a long downward arc.
This is shown in the top chart. Last Friday's drop was almost, but not quite retraced on Monday, the
autumnal equinox. Then on Tuesday, prices dropped sharply, aided by the revelations about
Trump's phone call with the leader of the Ukraine. By the end of the day I was able to lower
my swing trade stop to 3013, just above move 2. At that point a move 1, 2, and 3 could be labeled.
Today prices rallied to a possible 4 move of 7 in a Chaos Clamshell. Move 4 may even extend.
It could hold up into next week. Over the weekend Moon conjoins Mars, Sun, Venus, and Mercury
in succession.
The problem with this fairly short term Chaos Clamshell is that my ZD36 forecasts a move down into
early November. Assuming that the highs are part of an arc, one can draw lines from high to high,
then draw a bisecting perpendicular to these chords. Where these perpendiculars cross is the center
of the circle. The two I've sketched intersect somewhere at a much lower price.
This suggests a much larger pattern, which could well last into November.
Historically, October is the most frequent month crashes in the US stock market. The end of October
is the Brexit deadline. Impeachment investigations are underway. So the weeks ahead should be
be interesting.
The second chart shows an 8 hour bar chart of SH, a short Exchange Traded Fund. It show a double bottom,
followed by a small upturn, which may be the start of something much bigger. It could be a low risk
buying opportunity.
The interesting thing about this chart its that it shows a triangle pattern I call a "capstone."
The base of this capstone is 55 calendar days, which is two moon sidereal cycles.
If an up move does develop from here, the energy thrust general direction will be along the arrow shown.
For more on my work, see Moneytide.com
9/27/2019 1:33:35 PM MT Al****:: Have a good weekend clb, everyone
9/27/2019 1:23:07 PM MT Al****:: I'm done for the day; thanks for coming; see you next week; take some courses
9/27/2019 1:21:19 PM MT clb****:: Minor higher low and higher high. The down trend may be changing.
9/27/2019 1:21:18 PM MT Al****:: last hour bounce says R2/R3 bought by Flash Boys
9/27/2019 1:19:47 PM MT Al****:: coverin at 54;
9/27/2019 1:18:56 PM MT Al****:: not every trade, but I do that for new people
9/27/2019 1:11:30 PM MT bew:: i was wondering if someone was here to confirm my observations before making trade on the trade times
9/27/2019 1:09:03 PM MT Al****:: stop to 57, just above 110 EXMA
9/27/2019 1:01:45 PM MT Al****:: stop to 58, lock 15; at S2/S3
9/27/2019 1:00:49 PM MT Al****:: the chat room is always open; I monitor it, but do not sit in it and call live trades; I firmly believe you must learn to do it yourself. I do answer questions as best I can.
9/27/2019 12:56:10 PM MT bew:: is the chat room open m-th or only on fridays?
9/27/2019 12:52:35 PM MT Al****:: I do not do this every day; on Fridays I may or may not do what I am doing today; the Tomorrow's Market Email gives you the trade times for $297 per quarter; I also provide trading rules
as per the Trading the MoonTides tutorial linked on the right side of the list of charts page. You have to set up your own charts, apply the rules, and make your own trades.
That's for futures. For longer term stuff, watch my Chao Clinic
blog on MoneyTide.com. It is free.
9/27/2019 12:46:18 PM MT Fms:: What do we pay for these signals ?
9/27/2019 12:46:17 PM MT clb****:: Pattern is starting to look like a descending wedge. If it is, the eventual snap back could be strong.
9/27/2019 12:43:20 PM MT Al****:: tis is a day trade, which I will cover on close; my Chaos Clinic swing trade will still be open.
9/27/2019 12:42:02 PM MT Al****:: stop to 2960, lock 13
9/27/2019 12:40:36 PM MT Al****:: sounds good
9/27/2019 12:37:06 PM MT clb****:: I like to use ES option spreads that have a 3:1 potential profit to risk ratio. Buy short term spreads that last 5 to 10 days. The risk is always defined, and the potential profit is known before entry.
9/27/2019 12:35:16 PM MT Al****:: broke Wednesday's low.
9/27/2019 12:32:45 PM MT Al****:: it is also about the quality of your entry and how much risk you can afford. If you can get a good entry early in a move, and get your risk to zero or better, a swing trad makes sense.
9/27/2019 12:28:36 PM MT Al****:: here one wonders to day trade or swing trade; I do both in separate account, mostly using ETFs for swing and position trades, and futures for day trades;
9/27/2019 12:27:56 PM MT clb****:: I see what you mean. The counter rallies are not strong enough to bend the EMA's.
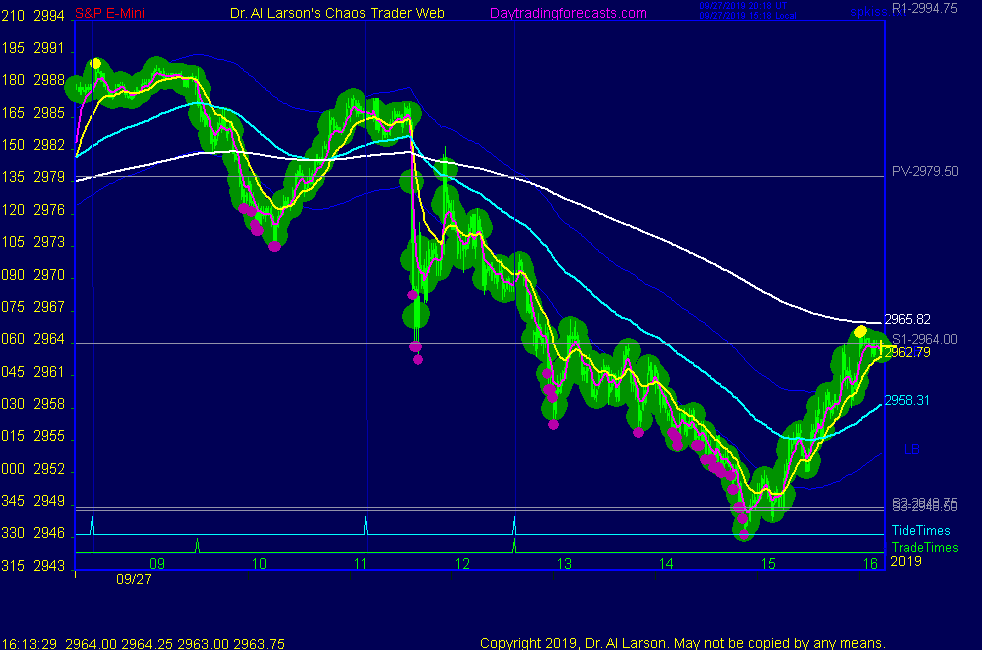
9/27/2019 12:25:20 PM MT Al****:: if you look closely at the 110,220, and 440 minute EXMAs, they are straight lines; sort of a limit down condition; says hold to close
9/27/2019 12:14:17 PM MT Al****:: coming to the Wednesday low
9/27/2019 12:12:19 PM MT Al****:: stop to 2964
9/27/2019 12:09:43 PM MT Al****:: right here, imagine your work at a hedge fund holding stocks
are you going to hold them over the weekend, or buy more?
9/27/2019 12:08:13 PM MT clb****:: Interesting about those 2 cycles. Price is starting to look weak now.
9/27/2019 12:07:36 PM MT Al****:: passing Mercury, looking for more energy
9/27/2019 12:06:13 PM MT Al****:: stop to 66, lock 7
9/27/2019 12:03:36 PM MT Al****:: starting new hourly bar with selling
9/27/2019 12:01:27 PM MT Al****:: I like 30 minute charts where I see 27.5 and 29.5 hour cycles,
the 24th harmonics of the 27.53 and 29.53 lunar cycles
9/27/2019 11:55:53 AM MT clb****:: Hourly bar charts make sense to me. It is a logical division of time. If your scaling is correct, you can really see good patterns on 60 minute charts. I also use 390 minute charts with outcry data only as a substitute for daily charts.
9/27/2019 11:50:40 AM MT Al****:: Flash Boys trade very short swings, using bid/ask/and tick data; larger firms like mutual funds use hourly or longer bars.
So I like to watch how the hourly bars set up; this one will be a bearish candle stick.
9/27/2019 11:48:02 AM MT clb****:: I would think the Mercury transit in a few minutes might give some energy.
9/27/2019 11:45:44 AM MT Al****:: back up to S1; was support near 11:40, now looks like resistance; have win no matter what, so sitting on my hands
9/27/2019 11:43:05 AM MT Al****:: thanks clb
9/27/2019 11:36:58 AM MT Al****:: stop to 68, juts above the 110; lock 5
9/27/2019 11:35:32 AM MT clb****:: On a daily chart, today's action is an engulfing bearish candlestick, indicating continuation of the down pattern since 9/19.
9/27/2019 11:33:13 AM MT Al****:: stop to 69, lock 4
9/27/2019 11:29:00 AM MT Al****:: note how the 110, 220, and 440 EXMAs are getting further apart; that is divergence
9/27/2019 11:27:19 AM MT Al****:: wave 5 may be extended
9/27/2019 11:25:50 AM MT Al****:: stop to 70, lock 3
9/27/2019 11:22:40 AM MT clb****:: It looks like 5 confirmed waves down since the open. Wave 6 in progress. Wave 7 might be large.
9/27/2019 11:20:08 AM MT Al****:: continuing below S1; stop to 72, lock 1
9/27/2019 11:14:34 AM MT Al****:: You are welcome. And thanks for posting the great chart in the CCT Room. I love it, and love having other CCT eyes on the problem
9/27/2019 11:13:59 AM MT Ted:: Ditto.
9/27/2019 11:12:04 AM MT clb****:: I am so thankful for doing these clinics on Fri. It is nice to see how you trade. Thanks for doing this.
9/27/2019 11:12:03 AM MT Al****:: Exchange passing Sun was a minor low; looks like minor congestion
9/27/2019 11:07:23 AM MT Al****:: OMG, clb; you're going to swell my head ! :)
9/27/2019 11:06:43 AM MT Al****:: meanwhile the 8 hour SH chart is looking up
9/27/2019 11:04:42 AM MT clb****:: You are hitting a home run today. If the Wed. low is broken at 2953, it could be quite a sell off.
9/27/2019 11:03:01 AM MT Al****:: that stop is just above the 110 minute EXMA
9/27/2019 11:01:26 AM MT Al****:: note how the EXMAs are curling over-the downtrend is accelerating
stop to 73, break even
9/27/2019 10:59:58 AM MT Al****:: the Flash Boys sold the pivot, now broke S1, should hit S2/3,
and maybe S4; thes pivot prices are on the SP1Day page
9/27/2019 10:57:23 AM MT Al****:: thanks clb!
9/27/2019 10:54:51 AM MT clb****:: For all CCT's, I posted another chart to the CCT room.
9/27/2019 10:51:55 AM MT Al****:: those high frequency vibrations are fibrillation, and precedes a heart attack-it is a precursor to chaos; learn more in the Cash In On Chaos course
9/27/2019 10:49:55 AM MT Al****:: lowering stop to 78, just above the 220
9/27/2019 10:48:32 AM MT Al****:: hitting a series like that is like sticking a piece of cardboard in a bicycle wheel; it sets up high speed vibrations
9/27/2019 10:45:47 AM MT Al****:: the Exchange (New York) has already rotated past Mars
and will rotate past Sun (13:00) , Venus, and Mercury by the close.
9/27/2019 10:39:52 AM MT Al****:: lowering stop to 2980, just above the 440 minute EXMA
9/27/2019 10:34:59 AM MT Al****:: here I like the way the 440, 220, and 110 minute EXMA's are diverging
9/27/2019 10:33:41 AM MT clb****:: I noticed the 10 point stop. Mechanically, that is the best place, but was more than I was willing to risk, so I am just watching now. Your sell, is starting to look good now.
9/27/2019 10:22:08 AM MT Al****:: that stop at 83 is above the last minor high; wider than I'd like, but that's what the market dictates
9/27/2019 10:19:58 AM MT clb****:: Getting away from the screen throughout the day is helpful to me. Getting a few minutes of sunshine every few hours has helped me. Until price finds a direction, it is just noise, and isn't usually profitable.
9/27/2019 10:19:50 AM MT Al****:: now sold 2973 stop 2983
9/27/2019 10:16:09 AM MT Al****:: taking the dogs with my wife is a lot more important than trading - I would not have tried to trade that anyway; not in trade window
9/27/2019 10:07:24 AM MT Rsf:: BAD DOG!!
9/27/2019 10:02:43 AM MT Al****:: missed all that wildness due to taking the dogs to the park
9/27/2019 10:01:37 AM MT Al****:: thanks GON
9/27/2019 9:47:32 AM MT clb****:: Quite a bit of volatility. That last bar was 20 points on a 3 minute chart.
9/27/2019 9:24:18 AM MT clb****:: It looks like it is trying to roll over, but is likely to hold up until T0.
9/27/2019 9:19:55 AM MT gon:: Hi Al, great article, thanks a lot. Major tops really take time...
9/27/2019 9:17:13 AM MT Al****:: whoops, this is a Tide time but not a trade time; trade selection software did not pick it because historically this is not a great trade time ; next trade near 12:30 Eqastern
9/27/2019 9:13:29 AM MT Al****:: second trade time not showing me a clear pattern yet; fast large moves screwed up the EXMAs
9/27/2019 8:48:44 AM MT Al****:: out for +3
9/27/2019 8:45:34 AM MT clb****:: Thanks, I wanted to add a chart.
9/27/2019 8:44:05 AM MT Al****:: users can update the first chart, so users have just one; I put my charts in chart 2 and 3, but you can't use them. So if you have a chart, just upload it.
9/27/2019 8:41:09 AM MT clb****:: Does the CCT room hold more that 1 chart at a time?
9/27/2019 8:33:27 AM MT Al****:: bounced back up to the pivot. Was on green +
Tide, could invert to red -Tide, so I will just hold may stop
9/27/2019 8:18:32 AM MT Al****:: this is looking serious; I will try to let it run; stop to 83, lock 3
9/27/2019 8:13:12 AM MT Al****:: stop to 84, lock 2
9/27/2019 8:12:34 AM MT Al****:: thanks clb. My FOG had me ready. I think the big boys held the market up while they distributed. Also waiting for the New Moon
9/27/2019 8:07:43 AM MT clb****:: Good morning. Great timing on that trade entry, Dr. Larson. I have been amazed that the market hasn't sold off this week yet. Maybe it happens today.
9/27/2019 8:06:32 AM MT Al****:: stop to 85, lock 1
9/27/2019 8:05:40 AM MT Al****:: in the larger context as per the Chaos Clinic writeup, this
could be the start of a move 5 down. Move 5s are often the biggest.
9/27/2019 8:02:38 AM MT Al****:: this is a steep move. if it develops a following it could
turn into a panic
9/27/2019 7:57:48 AM MT Al****:: passed the pivot; stop to 86 break even
9/27/2019 7:53:22 AM MT Al****:: stop to 88
9/27/2019 7:52:12 AM MT Al****:: looks like Flash Boys will run it down to the pivot at least at 79.5
9/27/2019 7:48:27 AM MT Al****:: stop to 90
9/27/2019 7:46:04 AM MT jvj****:: Good Morning Everyone
9/27/2019 7:44:14 AM MT Al****:: updated chart in CCT Room
9/27/2019 7:41:03 AM MT Al****:: sold 86 stop 91 on first MoonTide trade time
9/27/2019 7:10:31 AM MT Al****:: Fms: If you have taken the 4 courses, you will see a link to the CCT Room on the ListOfCharts page
9/27/2019 7:05:02 AM MT Fms:: How to go that room
9/27/2019 6:41:40 AM MT Al****:: I have placed a Face Of God chart in the Certified Chaos Trader's Room. That room is open
to graduates of my 4 main courses. See http://moneytide.com -> Courses for details.
eMylar Fractal of Pi overlays help you be patient, since they show you future potential moves.
The best bargain in my courses is to take the Cash In On Chaos and Fractal of Pi courses and
learn to use the FOP overlay. Then take Chaos Trading Made Easy, and finish with Face Of God.
9/27/2019 6:17:19 AM MT Al****:: right now looking East one sees a version of the Fertile Cresent,
with a "finger nail" new Moon, and Mars. This is a rising sign,
usually bearish for the market
9/27/2019 5:48:52 AM MT Al****:: GM all-good luck today. Chaos Clinic is posted on AUX page.
9:00 Eastern-System: No comments
![]()
![]()