

2:09 I'm done for the day; thanks for coming; see you next week; check out the special
2:08 aborting for -.5
2:01 I can't do any more but wait; if stopped net 0 for the day; if it breaks down, more profit
1:57 this is a volatility pinch; often precedes an energetic move
1:44 stop to 2545 - risk 1; 440 at 2544.84
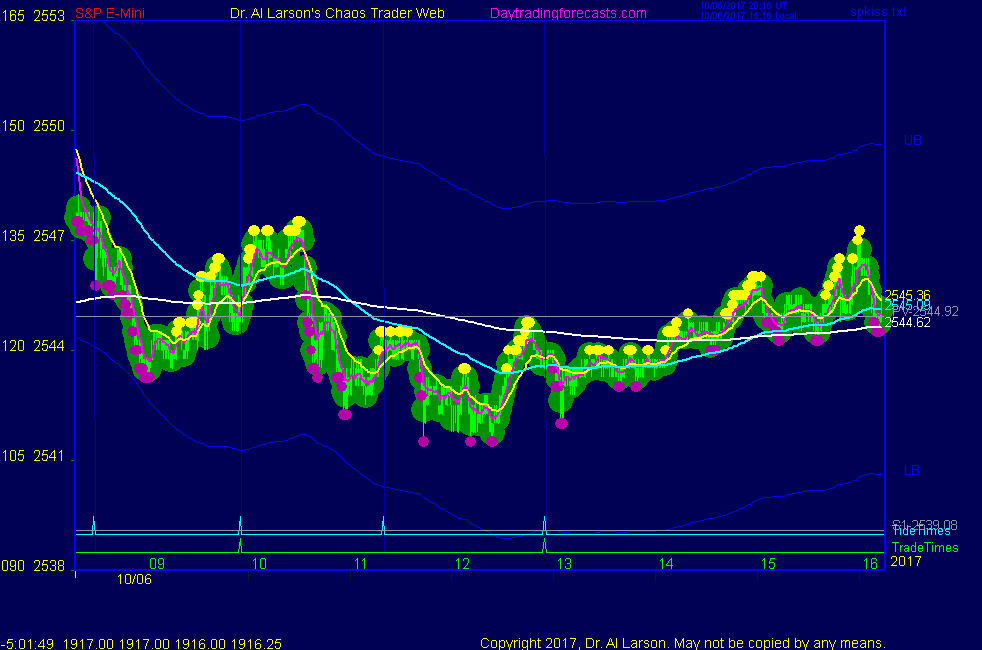
1:34 on SPKISS plasma chart last yellow pushballs were flat at 2544= resistance
1:22 pass the Moon/Jupiter/Uranus timelines near 2:00; could add energy
1:12 taking a +1 on the first trade helps here; my stop is for -1.5,
so in worst case I'm -.5 for the day on the MoonTide trades
1:08 added an updated chart to the CCT Room
1:04 stop to 2545.5; above the 440 EXMA
1:00 sold 2544 stop 2547 ; entry aided by my Fractal Grid
12:51 staying under 440 minute EXMA; watching for a continuation sell
12:44 out for +1; not much money but a lot of fun
12:30 stop to 2544.5, lock 1; 220 EXMA at 2544.38
12:23 24 hour range still not 9 points,l so relatively slow market; may change after 12:55
12:17 pyc in chat room tells me there is a beer name Patience
12:12 I like the divergence in the EXMA's; the 220 minute has not been
touched; good stop guide; now 2544.64
12:10 they need to make a beverage called Patience
12:00 stop to 2545; lock .5; I expect this move to accelerate
11:52 stop to 2546-risk .5
11:43 on the AUX page the thick white line is the 6 day mean-just broke below it
11:34 I have placed a Fractal Grid chart ( from Chaos Trading Made Easy course)
in the Certified Chaos Trader's Room. That room is open
to graduates of my 4 main courses. See http://moneytide.com -> Courses for details.
eMylar Fractal of Pi overlays help you be patient, since they show you future potential moves.
The best bargain in my courses is to take the Cash In On Chaos and Fractal of Pi courses and
learn to use the FOP overlay. Then take Chaos Trading Made Easy, and finish with Face Of God.
11:26 may be starting move 4; need to be patient with my stop
10:55 stop to 2547
10:37 move 3 starting-will try to hold for 7 moves
10:33 still OK-have move 1 and 2 of 7 in possible down Chaos Clamshell
10:20 looking OK
10:17 rally stopped at 50% retrace from yesterday's high to today's low
10:05 holding-accept that I may get stopped
9:52 sold 2545.5 stop 2548.5
9:45 possible continuation sell setting up
9:37 putting sell stop at 2543
9:35 normal session open-waiting
9:28 sold down to the pivot price of 2545
9:25 George Bayer, a contemporary of W. D. Gann, published a book called "The Egg Of Columbus."
In it he describes a rally pattern as a goose being served for dinner. At the end of the pattern is
the beak of the goose, who chokes on a nut, ending the rally. It could be this employment report is the nut.
Time will tell.
9:10 today's Tide times are 08:30, 09:56, 11:20, and 12:55. Software selected
09:56 and 12:55 as trade times, all in the regular session. The 8:30 Tide time coincided
with the employment report. I normally do not try to trade it. But today with the market
at an all time high and a very narrow range overnight, I could not resist. On the AUX page
is the chart I used. The yellow line is a day cycle, and it had turned down. Exma's gave a
sell signal before the announcement. I sold 2547.25 and have my stop at 2550. The jobs report
was a surprise -33,000. Now I want to see how the report is "digested." Hopefully there will be
good day trades near the 9:56 and 12:55 trade times.
9:00 Good Morning. Welcome to the Chaos Clinic. This site has a lot of charts,
so you may find it useful to have several of them available within your
browser. If you have a tabbed browser, you can open separate charts
in separate tabs by right clicking on any link, and selecting "open in new tab"
from the menu. The main list of site pages is at
http://daytradingforecasts.com/chartlistsec.asp
Recommended pages to watch are SPKISS, MTRainbow, and Chat.
For astro stuff, add SPSunMoonMer, Wheel, and Chaos Clinic.
Chaos clinic comments appear at the bottom of the SPKISS, MTRainbow,
and ChaosClinic pages. Comments in the chat room are announced by a
"duck call" noise. This noise also occurs when the sofware detects a
resonant hex pattern on the Wheel page. Trading tutorials
are on the right side of the ListOfCharts page. One should
read Trading the MoonTide Tutorial and Keep it Simple as a minimum.
9:00 Eastern-System: No comments
![]()
![]()