
2:26 OK, I'm done for the day; mixed Tides and Technocrap made it challenging but I did no real harm
while putting myself in a position to accept some gains
Thanks for coming. See you next week. take some courses
2:25 out for 0
2:23 stop is as close as I dare
2:16 moving buy limit back to 2184.5 - find myself dreaming of great riches :)
2:10 stop to 2189.5 break even; moving buy limit to 2181.5
2:07 getting another resonant hex
2:06 putting a buy limit at 2184.5; .5 above S1; stop to 2190.5; risk 1
2:02 looking better
2:00 I do notice that the high came on the T315 timeline; the T000 timeline near 2:30 may add juice
1:55 I've done all I can; just have to wait for the trade to work or fail
1:49 still looks like on red -Tide
1:36 getting hex resonance 1288 -may be short term stasbility
1:32 stop to 2191-just above the 440 -risk 1.5
1:28 stop to 2192-risk 2.5
1:21 this is now a down to close pattern-I will just try to hold short
1:16 stop to 2192.5, risk 3
1:13 sold 2189.5 stop 2193.5, the pivot
1:12 aborted for -2; Flash boys sold the pivot; inverted to red -Tide
1:10 stop OK so far
12:56 the Red and Green Swans are one of my better discoveries-they are electric field flux lines
they show where there is a lot of energy; prices may or may not "attach" to them; but every big day is support
by one of them
12:52 pressing a bit-bought 2192.5 stop 2189.5; basically buying the mean; it can sit there, or go up the green Swan
or stop me out
12:51 on the Chaos Clinic page the decline came down a Red Swan line and may go up the Green Swan line
12:47 now if prices regain the pivot, may get a modest rally as per the green +Tide
12:43 we now have prices trading both sides of the 440/220/110 EXMA mean, and buying about 3 points below the mean
12:27 these hex patterns tend to stabilize prices
12:25 if you have your sound on you may hear a "duck call" announcing that a hex pattern has been detected on the
Wheel page-see the tutorial on Hex Wheels and Hex Wheels today linked on the right side of the ListOfCharts page
12:18 the rainbow of EXMas is converging to about 2193; the Flash Boys have probable switched to a "reversion to the mean" algo
this will tend to rebalance prices near the pivot point
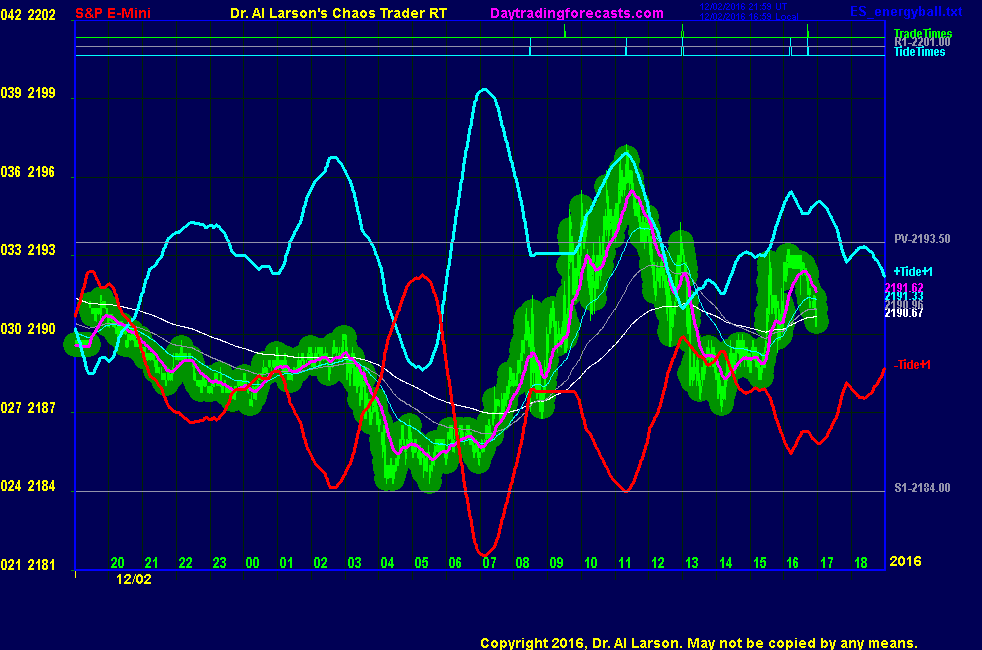
12:13 the pattern on the AUX page is a "MoonTide Fractal Set"-the market equivalent of the famous Mandelbrot set
Benoit Mandelbrot invented fractal geometry
12:05 these opposing MoonTides are a consequence of the physical structure of the solar system. Energy waves
from the sun hit our ionosphere and launch 2 waves into the Earth-ionosphere waveguide-one going ion each direction
this makes the system chaotic, because it has 2 solutions; just like our electoral process !
As bad as it might seem to some, a two party system is better than a one party system.
12:02 on the AUX chart, I've added the +Tide-you can see how it fits. So this is a mixed Tide day
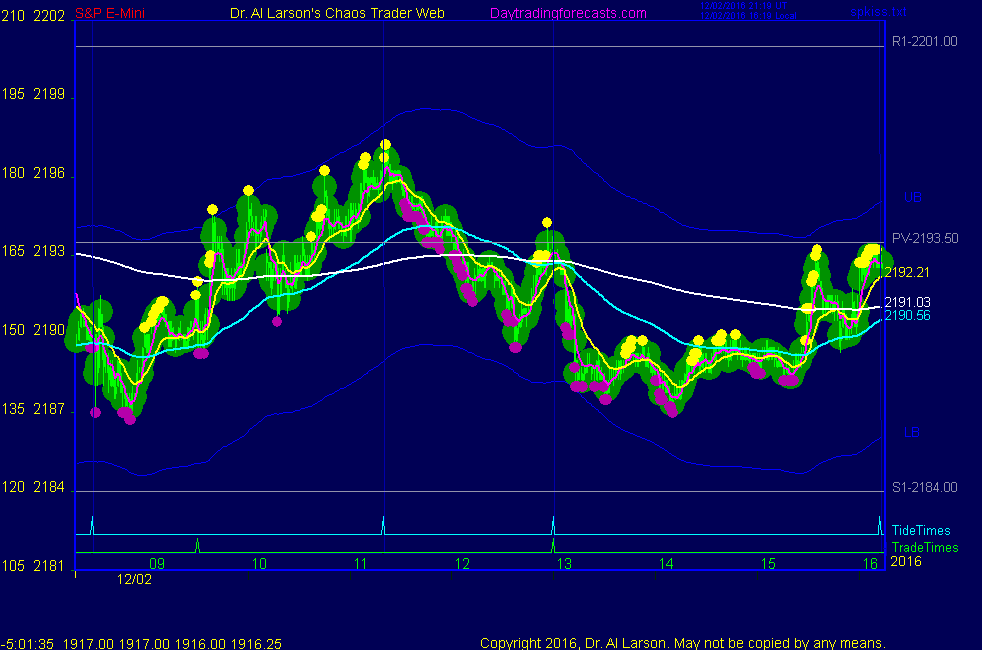
11:54 looking at the SPKISS chart the high was marked by an isolated yellow pushball at the 11:20 Tide time
this suggests the green +Tide set the high
11:50 my focus has been on not loosing my cool when faced with the technocrap, then not losing money
on a less than optimal trade entry
11:45 stopped out for .25; now I just wait until the next Tide time
11:36 stop to 2193.75-lock one tick; this is a late entry so is riskier than normal
11:25 stop to 2193.5 breakeven
11:21 stop to 2193, risk .5; moved it to just under the 110
11:17 still OK
11:09 stop to 2191.5 - risk 2
11:01 stop to 2191; risk 2.5
10:51 R1 is at 2201; placing a cover stop at 2200.5; will move my stop along the 220 minute EXMA
10:40 bought 2193.5 stop 2190.5; best I can do under the circumstances; I figure the Flash Boys might buy the
pivot, and the EXMA rainbow is up, with a dip to the rising 110 minute EXMA, but not touching the 220
10:37 The 2193.5 is the correct pivot. The copy on this computer is wrong;
10:35 OK, have another technocrap program; I have two different set of pivot prices on two of my charts on my
trading computers; checking that out
10:30 prices are trading near the Pivot price of 2193.5 ; Flash boy algos moved it from S1 to the pivot;
may try to buy the pivot
10:20 the we now have a thrust and congestion; another thrust may be tradable, possibly near the next
Tide time of 11:20
10:15 the rainbow of EXMAs started diverging near 8:20 Eastern; if one were nimble, a buy just after the open
near 2190 may have gotten 5 points
10:12 I think this rally is losing steam; it is about 6 hours old;
10:08 I'm placing the chart I'm watching on the AUX page;
10:03 what is important is that I not try to jump in and get a bad entry. I'll wait for a dip before even considering
and entry.
10:01 all that distraction meant I missed a trade; This is not a big deal. There is always another trade coming.
10:00 sorry about the TECHNOCRAP-technology that almost works-I coined the word. Use it.
Spread it. I want it in the official dictionary.
9:57 OK, data should be good now
9:48 I now am getting data, but there is some missing; I need to patch that.
9:45 this is what I mean when I say I'll do a Clinic "technocrap permitting." It takes a lot of software to
do this; It runs on two computers, a web server and a data server; Fortunately I wrote all the application code
for both machines, so I know how to fix problems. But that does not make it easy.
9:37 my data server is hung up-working on it
9:33 seems TECHNOCRAP HAS STRUCK; some charts are not working-I need to fix that before any trading
9:28 a 9:31 trade time on Fridays is tr4icky-I'll wait a bit after that; the trade window is normally +/- 45 minutes, although it is usually much narrower
9:22 we have been in a decline for 2 days , which may be near an end. Support came in just above the S1 level of the pivot prices.
9:21 today's trade times are 09:31 and 13:00
9:20 Good Morning. Welcome to the Chaos Clinic. This site has a lot of charts,
so you may find it useful to have several of them available within your
browser. If you have a tabbed browser, you can open separate charts
in separate tabs by right clicking on any link, and selecting "open in new tab"
from the menu. The main list of site pages is at
http://daytradingforecasts.com/chartlistsec.asp
Recommended pages to watch are SPKISS, MTRainbow, and Chat.
For astro stuff, add SPSunMoonMer, Wheel, and Chaos Clinic.
Chaos clinic comments appear at the bottom of the SPKISS, MTRainbow,
and ChaosClinic pages. Comments in the chat room are announced by a
"duck call" noise. This noise also occurs when the sofware detects a
resonant hex pattern on the Wheel page. Trading tutorials
are on the right side of the ListOfCharts page. One should
read Trading the MoonTide Tutorial and Keep it Simple as a minimum.
9:00 Eastern-System: No comments
![]()
![]()