![]()
![]()
********************************************************************************
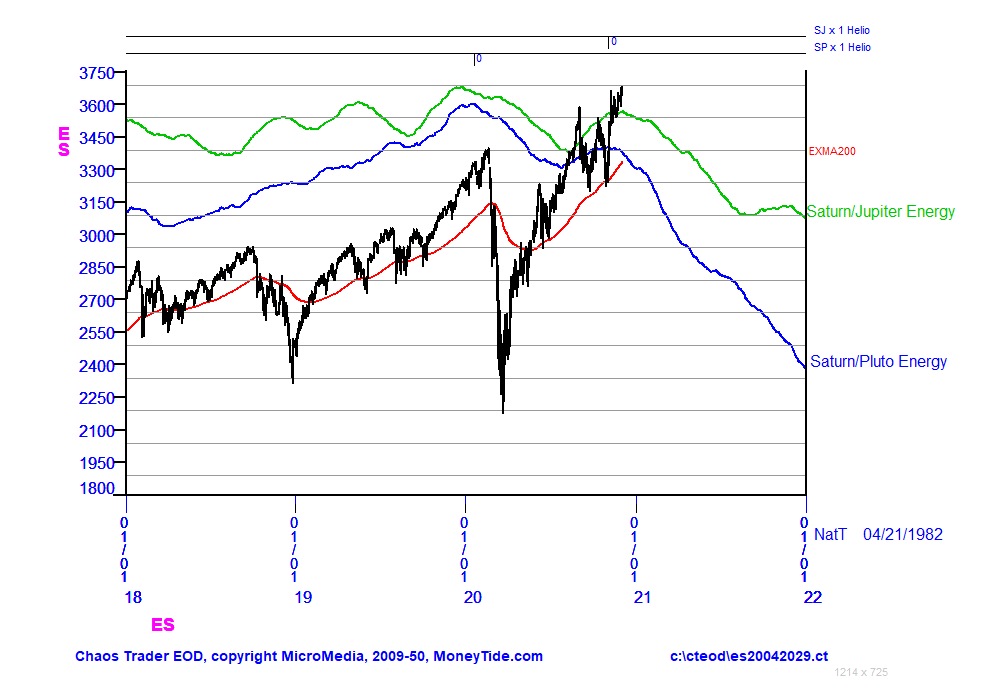
Energy Forecast For The S&P
Chaos Clinic for 12/4/2020
********************************************************************************
While COVID-19 has dominated the news and life in 2020, there are larger forces at work
This chart shows a energy forecast based on them.
The two major cycles at work this year are the Saturn/Pluto cycle and the Saturn/Jupiter cycle.
Both of these cycles had heliocentric conjunctions in 2020. The Saturn/Pluto cycle turned
down in February, just as COVID-19 panicked the S&P. Now the S&P has rallied, all the
way back up into the Saturn/Pluto conjunction.
Overlaid on the chart are two energy forecasts made with my WinXGO program. The
blue line is the Saturn/Pluto energy, and the green line is the Saturn/Jupiter
energy. These are computed using only the first trade date of the S&P, and the
length of the cycles. First the XGO forecast is computed. This is a short term forecast.
The longer term cycles are created by filtering the XGO forecast with a Zero Delay filter
set to the length of the longer cycle.
The downside of this is that the turns in the longer cycles are rounded, making them unsuitable
for short term trading, but good for position trading and investing. Another drawback is that
the energy forecast is not a price forecast.The vertical scaling is arbitrary.
One aid is to use natural vibration levels. Prices tend to make major turns at multiples of these
vibration levels. I have labeled swings of 4, 7, 8, and 10 vibration levels.
As an aid in using the forecasts, I use tracking EXMAs. This chart shows only one, a 200
day EXMA. It sort of tracks the forecasts, but is late on the turns, so a better tracking
system would be to add a 100, 50, and 25 day.
The message of this chart is simply this: "Be alert for the S&P to decline in 2021."
WinXGO is a unique forecasting tool. You can learn more about it at [ WINXGO ]
For more on my work see
Moneytide.com
12/4/2020 2:14:04 PM MT Al****:: interesting-ran it up until stocks closed, then sold futures
12/4/2020 1:44:21 PM MT Al****:: held it up-done for day-thanks for coming-see you next week
12/4/2020 1:38:28 PM MT Al****:: lower high, passing Moon timeline
12/4/2020 1:25:54 PM MT Al****:: on 3 minute chart watch to see what happens on 9th candle after the high
12/4/2020 1:23:19 PM MT Al****:: last high was 3 hours after solar noon
12/4/2020 1:22:32 PM MT Al****:: you are welcome
12/4/2020 1:18:13 PM MT qq:: Thanks Al
12/4/2020 1:14:37 PM MT Al****:: sometimes you ask for a chart just after the old one has been removed but the new one is not yet posted
12/4/2020 1:13:16 PM MT Al****:: check it in 8 minutes
12/4/2020 1:11:28 PM MT qq:: XGO was updating, but now it's not showing.
12/4/2020 12:55:34 PM MT Al****:: tested yellow vibe on ESNat 72
12/4/2020 12:45:51 PM MT TG****:: On 24 Hr chart, tagged 440 then bounced well enough to close back obove the 110 pretty quickly.
12/4/2020 12:38:44 PM MT Al****:: this was not a good jobs report, and the next one is not until Jan 8 because the first Friday of Jan is New Years Day, so may see some longs cover
12/4/2020 12:09:59 PM MT Al****:: I was about to mention that late Moon timeline might add some energy
12/4/2020 12:09:17 PM MT Al****:: yes
12/4/2020 12:07:38 PM MT TG****:: AL, would you call today a two moon day?
12/4/2020 12:00:13 PM MT Al****:: just based on esnat72 vibration high still holding
12/4/2020 11:57:30 AM MT Al****:: looks like it might sell off
12/4/2020 11:56:18 AM MT qq:: I'm guessing a small pullback and a tiny up. I don't see much action
12/4/2020 11:54:05 AM MT jvj****:: Am not too interested in getting in here today.
12/4/2020 11:41:28 AM MT TG****:: anyone else buying here. took it as a hook and go but not crazy about the nature of the initially jerky looking tide time.
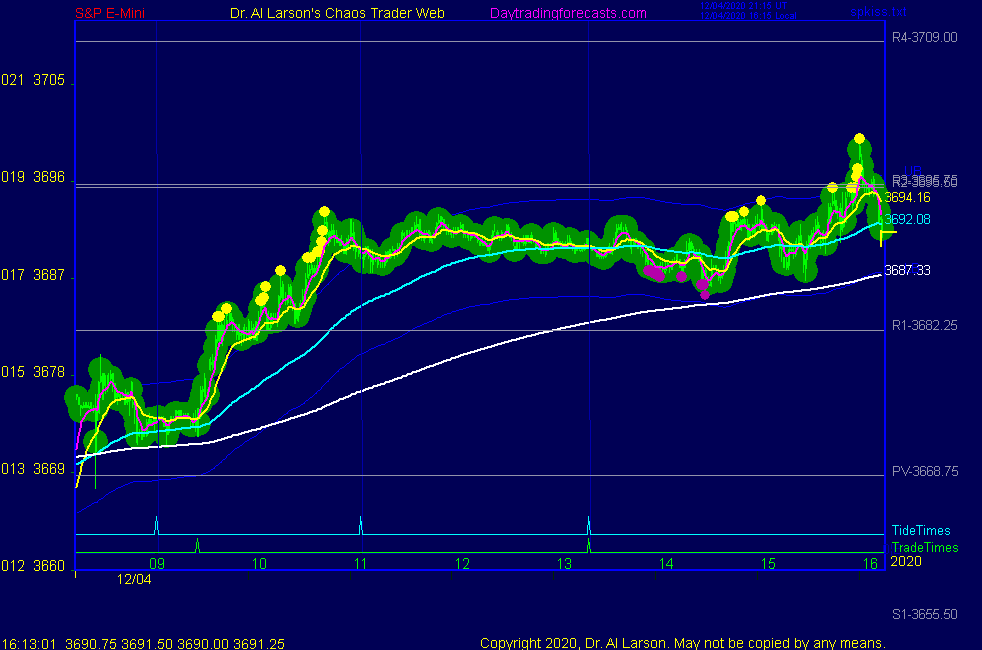
12/4/2020 8:57:55 AM MT Al****:: note the Secret->esnat72 chart: early vertical lines were the energy source for opening rally
12/4/2020 8:15:29 AM MT Al****:: yes! you get the prize for the best eyes!
12/4/2020 7:54:09 AM MT qq:: Last on SPKISS?
12/4/2020 6:55:38 AM MT Al****:: I've added a new chart today - who can find it?
12/4/2020 6:53:17 AM MT Al****:: Good Morning visitors. Welcome to the Chaos Clinic.
The written Chaos Clinic is on the AUX page.
This site has a lot of charts,
so you may find it useful to have several of them available within your
browser. If you have a tabbed browser, you can open separate charts
in separate tabs by right clicking on any link, and selecting "open in new tab"
from the menu. The main list of site pages is at
http://daytradingforecasts.com/chartlistsec.asp
Recommended pages to watch are SPKISS, MTRainbow, and Chat.
For astro stuff, add SPSunMoon, Wheel, and Chaos Clinic.
A special set of Dr. Al's research charts are on the Secret page.
Comments in the chat room are announced by a
"duck call" noise. This noise also occurs when the sofware detects a
resonant hex pattern on the Wheel page. MoonTide trading tutorials
are on the right side of the ListOfCharts page. One should
read Trading the MoonTide Tutorial and Keep it Simple as a minimum.
Many subcribers do not strictly trade the MoonTides, but use the charts on this
site as input to their own trading strategies. For example, the bottom chart on the
SPKiss page is good starting point for swing traders.
Also on this site is the Certified Chaos Trader's Room. That room is open
to graduates of my 4 main courses. See http://moneytide.com -> Courses for details.
9:00 Eastern-System: No comments
![]()
![]()