

8:00 Eastern
The solar eclipse of 8/21/2017 created a huge gathering of people-a conjunction.
It was followed by some very nasty weather, with three major hurricanes making land fall
in the US, and huge forest fires in California, whipped by strong winds.
It also sparked a sharp rally in the US markets. Since the low of the
Crash of 2007-2009 in March, 2009, the S&P has rallied 300 percent. The futures low of
666, multiplied by a harmonic 4, is 2664, very close to the all time high of 2675.5.
With the current bull market over 8 years old, and constantly making new record highs
without a significant pullback, many are wondering, "Where is the top?"
I always thought the top would be near 2700, up 900 harmonic points from the lows
near 1800 made in 2014 and 2016. So when the S&P got above 2600, I started paying close
attention. Part of that is my analysis of the chart on the AUX page.
That chart shows the rally up from the solar eclipse of 8/21/2017. In a a move, I'm always
looking for a fractal pattern with 7 swings. To help identify these I use a rainbow of EXMAs.
When this move got to 7, however, it did not end. It continued on, and on. Eventually, I realized
it was a 13 move fractal, which I sometimes call a double fractal. In my studies I have found these
occur about 10 percent of the time. I have never found a fractal with more than 13 moves. The rally
shown on the AUX chart has 13 moves.
Rallies often end with a blow off move. Buying gets more and more frenetic until the last buy is in. Then
the demand collapses. A blow off move therefore has steeper and steeper slopes. The solar eclipse rally has
3 different slopes. The steepest slope was broken 12/14/2017.
This suggests at least a pullback, if not the top, of this incredible bull market. Of course,
it will take move evidence to confirm that, but trader should be alert. Investors may want to move
some of their bull market gains into cash.
Other signs the end is near:
1) the euphoria over getting rich quick in Bitcoin
and other crypto currencies, which are not currencies at all, but the invention of hackers;
2) the laggards are finally
rallying, like Twitter; and
3) general complacency about any correction.
Looking ahead, I have two critical dates: 1/8/2018 and 3/9/2018. The first is a significant
astrophysical event, and the second is the 9th anniversary of the crash low.
I am also concerned about another huge gathering of people - the Olympics in February in Korea.
So be alert, we can always use more lerts :)
Happy trading!
Dr. Al
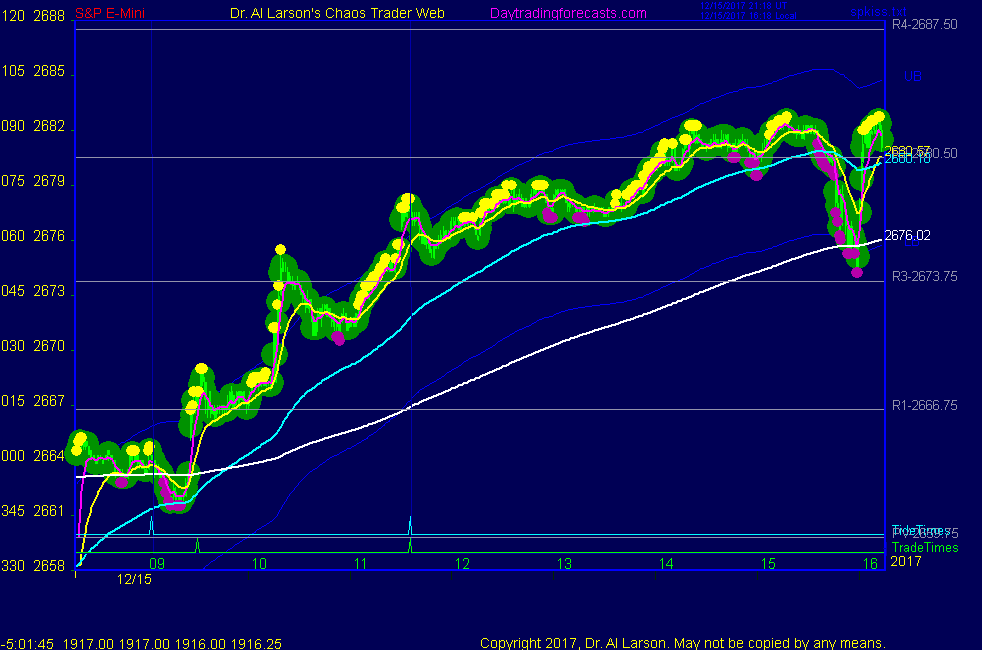
15:15 Eastern - POSTSCRIPT
Today's big rally more than recovered the break of the steepest trend line of yesterday.
The pullback bottomed on the extension of the Steeper trend line. But today's rally is at an
even steeper trend line. So one still needs to be aware that this is some sort of a blow off move.
When it breaks it will not be pretty.
9:00 Eastern-System: No comments
![]()
![]()