
March 29, 2001
Been a little confused by the market lately? Think it's just the bulls and the bears? Or do you think that Sun Square Whoever means a bottom? Well, if you think it's all that simple, you just don't understand the complex nature of what goes on in the market. Of course, we like to try to simplify things- that's what genius does. But to do that intelligently requires a knowledge of the physics underlying the market. So this page is a detailed look "under the hood" of two days in the S&P futures market.

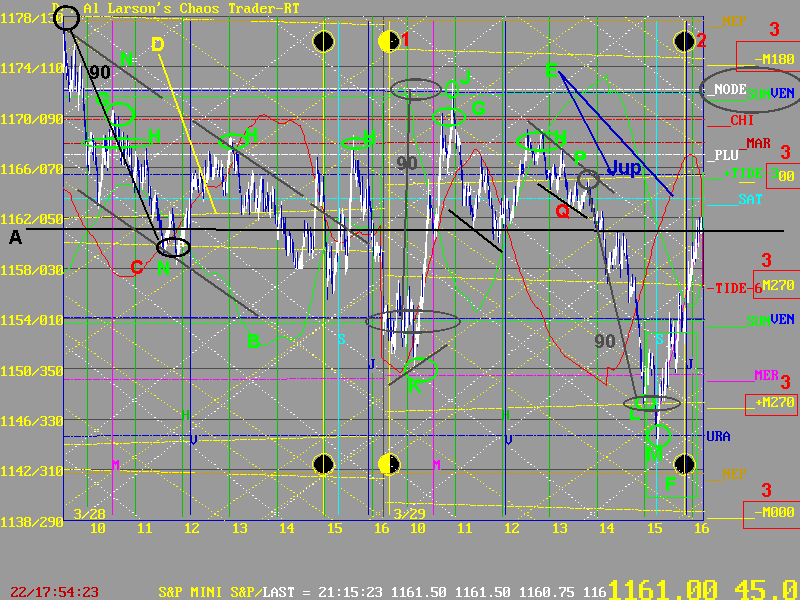
Don't be blown away by this chart. We'll take it a step at a time.
First, the blue and white line moving up and down are 1 minute candelsticks on the S&P. Then the horizontal lines are the electric field flux lines produced by each planet. One set of these, the yellow moon flux, are marked in by red 3's on the right of the page. These have a MAJOR effect on the S&P, setting the "quantum levels" of price action. They are 90 degrees apart.
The vertical lines mark where the Exchange, rotated by the earth, passes each of the planets, either overhead or underfoot. For the Moon, I add in the points where the Moon is 90 degrees to the exchange. The vertical line at the red 1 is one of these. The vertical line at the red 2 shows the point where the exchange is lining up with the New Moon. It is also lining up with Jupiter and Saturn. See the green box at F.
One way to simplify this maze of activity, is to reduce it all to an equation that computes a forecast for price activity. I do this with my MoonTides. But it turns out, that doe to the fact that every impulse on the ionosphere goes both ways around the earth, there are ALWAYS TWO waves. The green one is the "normal" wave, and the red one is the "inverted" wave. These waves combine to form "fractal sets." In this case, if you look at the black line drawn along the 1161 price level, you see that it is the true center of the fractal set. It is at a mathematically perfect 45 degrees, the 8th harmonic of the circle. The nearest planet flux line to this is Saturn, so I call this a Saturn Fractal set. Notice how prices followed this set pretty well over the two days.
But WHY this planet? Look at line D. It is the electric field flux line of the Moon. It crosses the Saturn flux (see E ) between the two days, and ends the second day at the Jupiter flux. So it was the Moon that not only set up the shape of the Fractal set by generating the MoonTides, but it also set the centerline of the fractal set.
The MoonTides are a gross simplification of what all is going on. There is a lot more. For example, the flux lines form support and resistance levels. The Chiron flux set the highs at G. Mars set the highs at H. And the Node/Sun/ Venus flux bundle set the high at J. MErcury set the low at K, and the Moon set the low at L. Uranus set the low at M.
But there is still another layer. The rotating earth and the Moon's 24th harmonic generate flux lines, too. They are the set of lines at about a 30 degree diagonal. The white are the earth, and the yellow are the Moon. They tend to form channels, and minor support and resistance lines. I've marked some with black lines at K, N, Q, and P.
So how does one make any sense out of this? Well, it's not easy. But one can deduce that if the Moon flux are 90 degrees apart, one would see a lot of 90 degree moves in the S&P. I've marked 3 on this chart. They are in black. The second two were actually forecast by the large swings in the MoonTides. I used this knowledge to make up today's 1ADAY, which caught the opening rally for 12 points. Sometimes, with a bit of luck, the knowledge pays off.
So that's a glimpse of what goes on under the hood. It's far more complex than just one aspect of two planets. Each aspect is just one note by one singer in a chorus, which must sing to the notes of a harmonic scale. It may be impossible to listen to all the notes, but one can appreciate the music.
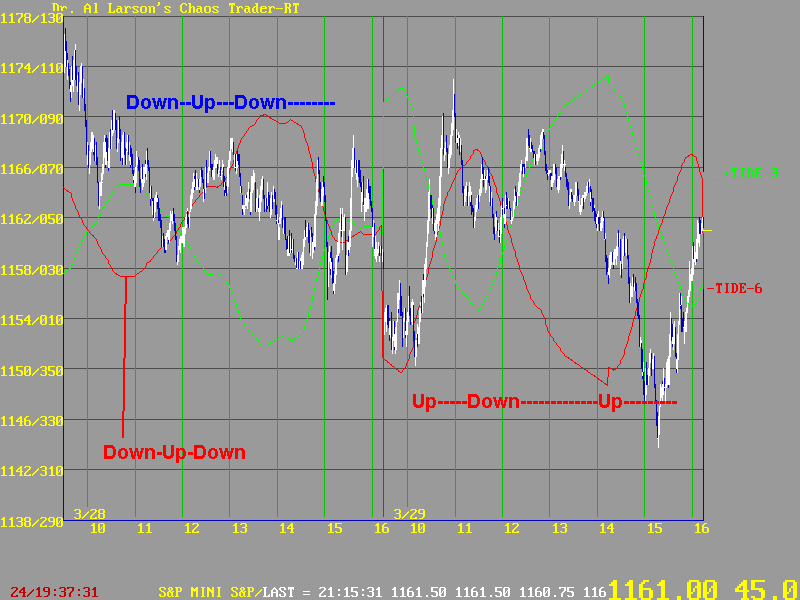
If one backs off far enough, there are some simplifications that are helpful. One is shown below.

If one simply watches the first move of the day, and allows for some distortion in the forecast pattern, one can often see that the music IS THERE. On these two days, the market followed the general pattern of the inverted red MoonTide. So if one gives up on expecting perfection all the time, (Amy are you listening?) one can hear the music.