
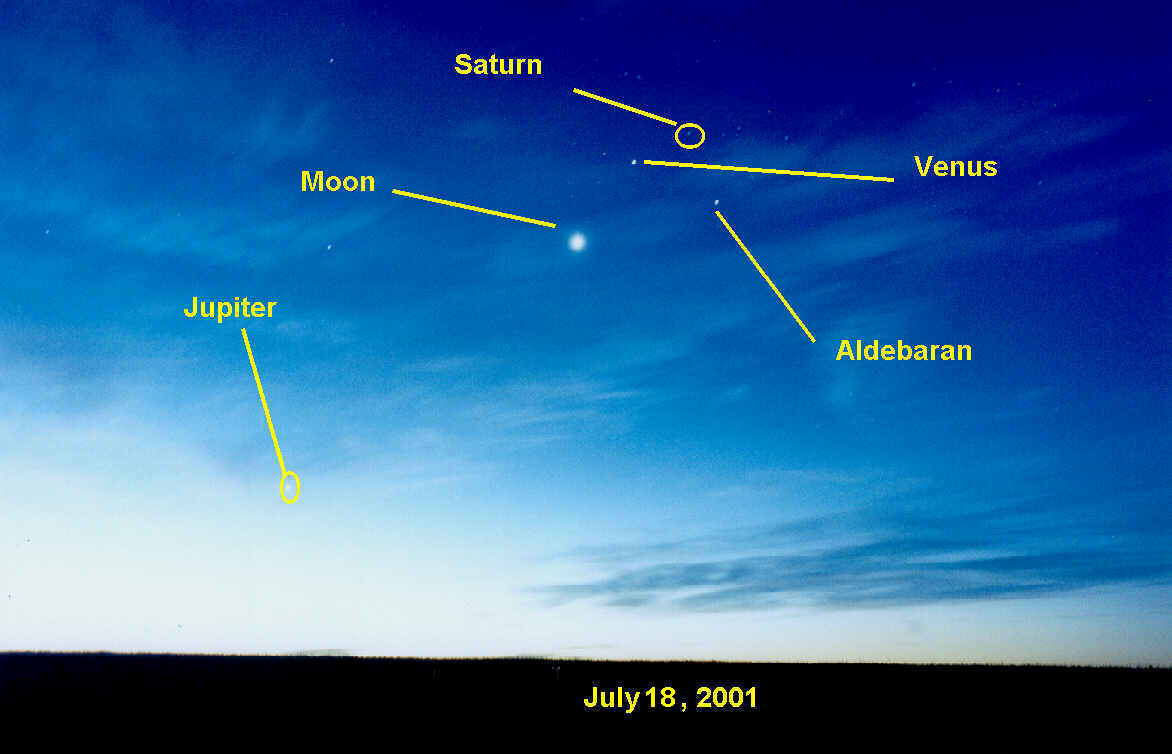
Last week I encouraged you to go out and see the 3 day rising sign, and then to watch how it affected the market. The effect was not a tanking of the market ( the average tendency), but a very chaotic rally. This page shows how the physical motion of the heavenly bodies and the prices ARE TIGHTLY CONNECTED.
First, here is the rising sign as seen on the 18th and 19th. My picture for the 17th didn't turn out.
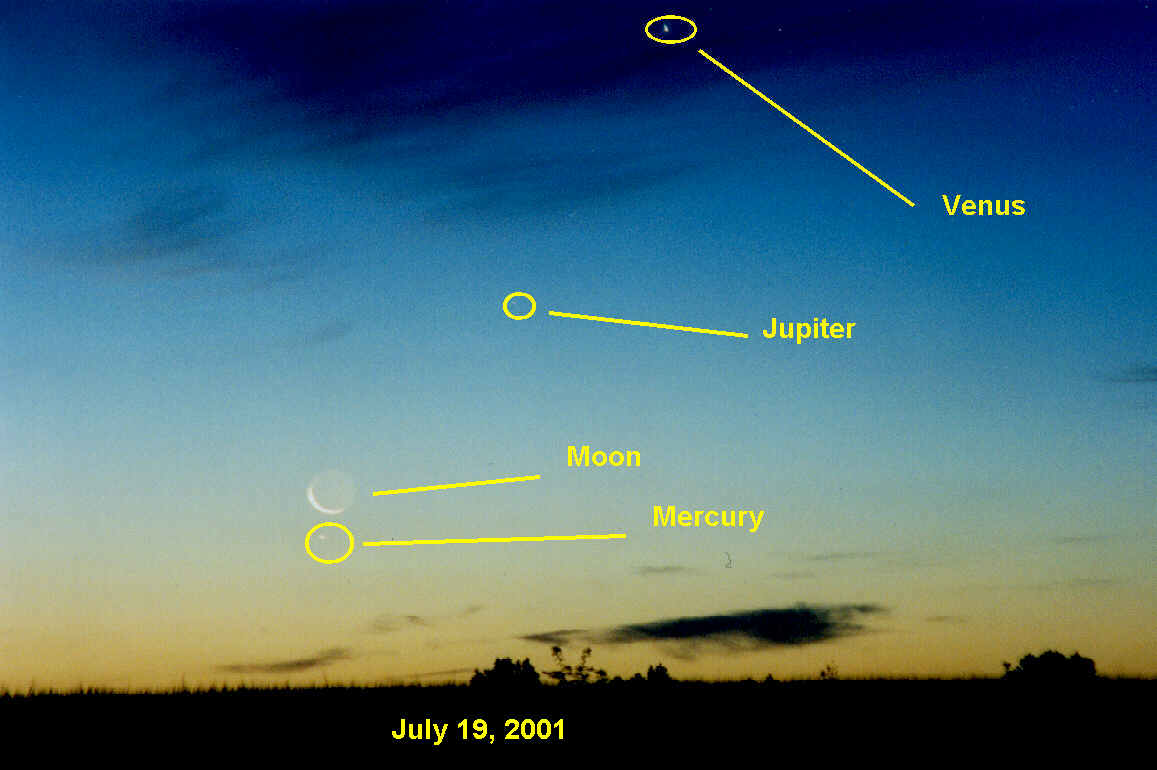
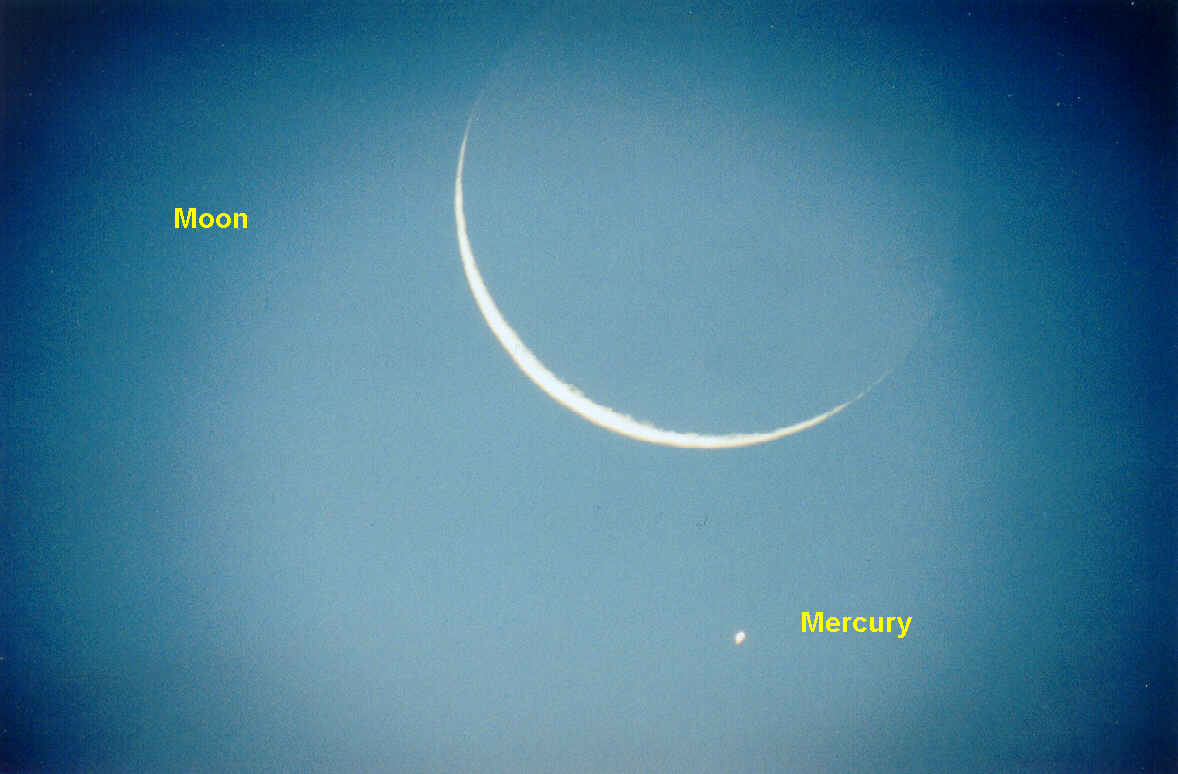
This is a rare photo of Mercury. It's hard to get because it is so close to the sun. Now, as the Moon moved lower, it reached a point where Mercury was above the Moon, looking like the Fertile Cresent often seen the Middle East. Only Venus and Mercury regularly form this pattern. Often it means a market top. My saying is, "Fingernail Moon, Market Top."
My dog Ace and I got up every morning to see this spectacular site. This morning we went to the park twice, the second time with my telescope to get the close up of Moon and Mercury.
When we came back, he went back to bed, and I watched to see how the rising sign would affect the market. Here's the 3 day chart. It's pretty busy, but I'll step through it slowly.
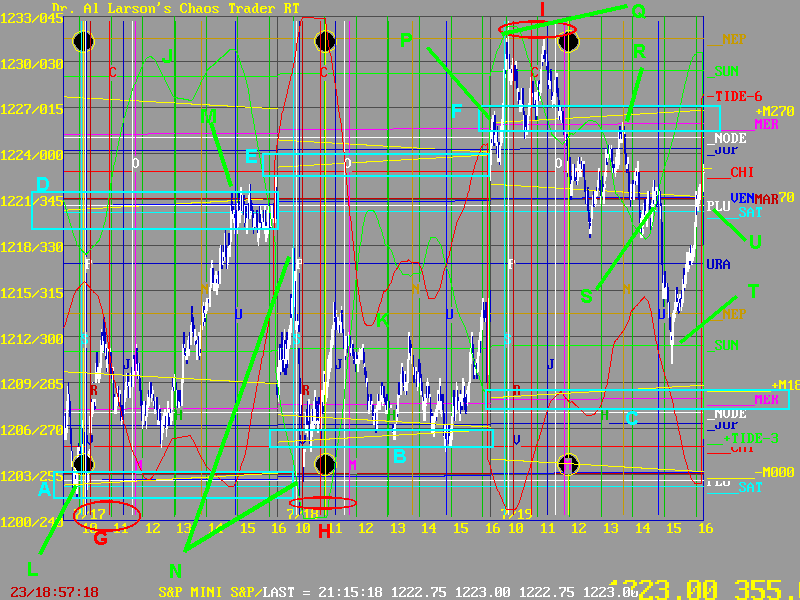
Find the 3 light blue boxes A, B, and C. These are at a price 180 degrees from the rising sign. The chart is upside down from the photos. In the photos, the Moon moves down from Saturn to Mercury. Here, the yellow flux line is the Moon, rising from the light blue Saturn flux to the magenta Mercury flux.
Now find the next higher rising sign flux bundle at D, E,and F. These are 90 degrees from the rising sign.
Now find the three red ovals G, H, and I. These mark the times when the Exchange was passing the rising sign pattern. J and K are the + and - MoonTides. The first day's Tides showed a turn at 10:18.
This turn came right at L. As soon as I saw it bottom here, I expected the green +MoonTide was in effect, and we might not have a market tank. Fortunately, the 1ADay trade was set up to go either way (due to chaos) and we got a quick gain.
That rally ran up to top out at M, right on the other rising sign flux bundle. That was a typical "band gap energy jump." The rally stopped as the Exchange passed Uranus.
So day 1 one of the sign was up, from 180 degrees to 90 degrees from the sign.
The next day opened gap down. Traders were nervous as Alan Greenspan was speaking to Congress. What a day to speak. As the Exchange (and Congress) passed Saturn, the first planet in the rising sign, prices dropped 15 points in 8 minutes, as shown at N. They bounced from the flux bundle A, then formed a base on the flux bundle B during the day. Finally, as the Exchange passed Uranus, prices rallied.
So the second day, the rising sign started chaos, then stopped it. The third day was even more interesting.
I knew when I say the Moon hanging over Mercury, that prices would reflect that. Prices opened EXACTLY on the Mercury/Moon flux crossing at P. They rallied. Traders were bullish. Then the Exchange passed the first planet of the rising sign-Saturn, at Q. The bearish nature of rising signes then showed its power.
The high price was set by Neptune. From there prices fell back to the Mercury/Moon flux, bounced back up to Nepturne, then dropped sharply AS THE EXCHANGE ROTATED PAST-can you guess? - MERCURY, and the MOON.
The drop went just below the bottom of the rising sign (Saturn flux) then rallied back up to the Mercury flux at R. That point also happened to be a key turn in the Fractal of Pi pattern. We did a sell at 1224, stop 1228. Mercury was support, now it was resistance.
The trade was up 3 points as the Exchange approached Uranus. As it passed it at S, prices dropped sharply. They got support from the Sun flux (sunrise) at T, so we Cashed In On Chaos at 1215. The Fractal of Pi pattern also indicated an end to the down fractal. Prices bounced into the close, to end near the rising sign flux bundle at U.
So on the third day, the rising sign yanked prices up, then dropped them back down.
Very often, a rising or setting sign pushes the market one way, then when it ends, the market goes the other way. This rising sign ended this morning, and the market headed down. The rising sign rally never reached the price of the rising sign, which is at 1239. Another way to look at it is to locate the chaos theory Strange Attractor/Strange Repellor. That I did using my Face of God pattern. The result is shown below. (The actual FOG pattern is available in the FOGGER's ROOM for graduates of that course.)
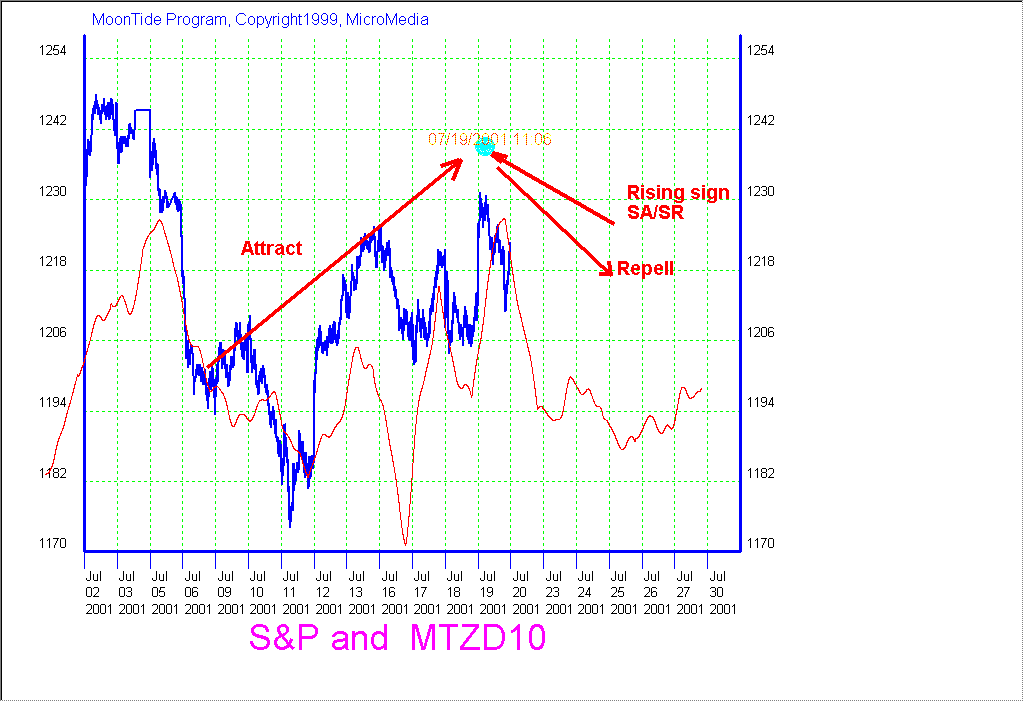
The line shown is the inverted 10 day MoonTide. It's been a helpful tool so far this month. There are never any guarantees in chaotic systems, but the rising sign seems to have formed a short term top, just like the lunar eclipse did.
This was a pretty wild rising sign. But to the knowledgable, the price was always behaving according to the rules of this chaotic, PHYSICAL system. And if you were alert, and used the right tools, it was possible to Cash in on this Rising Sign Chaos.
If you are a serious market student, the place to start is with the Chaos Trader's Trilogy.
![]()
![]()