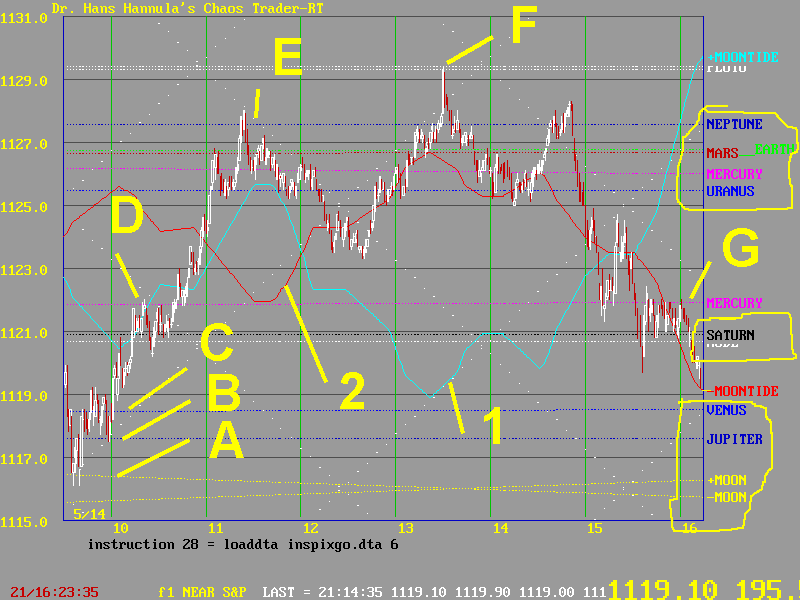


This chart shows the S&P on May 14, 1998.
The earth's electric field is affected by the electric fields of all the planets. As the earth rotates, it moves the Exchange through all the planetary electric fields. These fields show up in price action very clearly, if one uses the right software.
On my morning walk on May 14th, I noticed the waning full moon, Jupiter, and Venus in the morning sky. Unlike April 23rd, they were spread out in an arc.
So it was no surprise that prices started near these lines at A,B, and C. Of course, the +MoonTide at 1 and the -MoonTide at 2 forecast the probable price motion. But the planetary lines form the resistance and support points. For example, Mercury was resistance at D and G.
Prices rallied in the morning, following their bounce off the Moon lines. They paused at D, due to Mercury, Node, and Saturn. Passing that, they rallied to the Neptune, Mars, Earth, Mercury, and Uranus cluster at E. Prices vibrated near this cluster for several hours.
After following the +MoonTide during the rally, they switched to the -MoonTide about 12:30. They continued to follow it right into the close.
The high of the day at F was the high in the -MoonTide. It popped up to the white Pluto lines at F. Pluto and the moon work together, through a resonance effect. That's why the peak was so sharp.
So all the fields act together. Sorting them out is not easy, but it can be profitable. Pretty neat, huh?