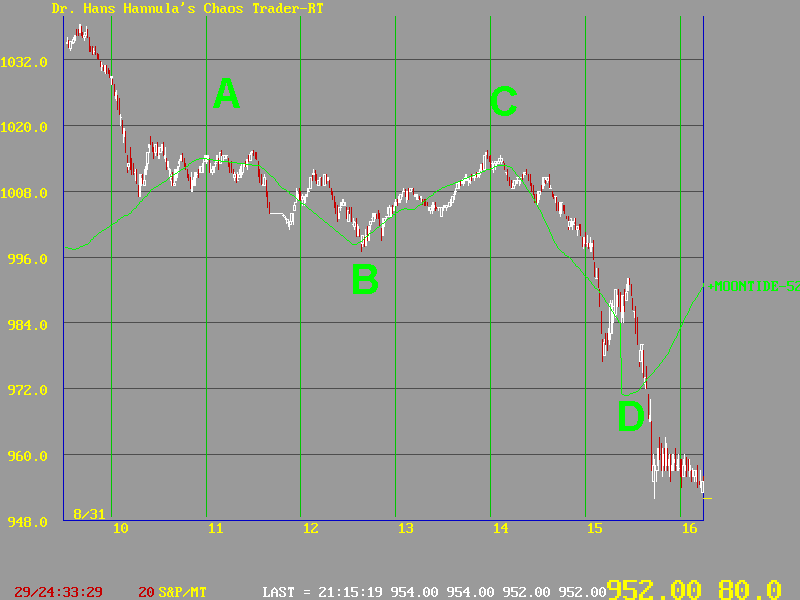

This chart shows the S&P 500 on August 31, 1998, a day when the DOW dropped 512 points. The market did not follow the MoonTide early in the day, but started following it after an hour. The pattern started matching at A, then fit the low at B, and made the high at C. Then it dropped sharply into the close, "going chaotic" at D, where the MoonTide "jumped vertical." At least one MoonTide subscriber recognized the fit between the market and the MoonTide and caught the big drop. MoonTides can give a trader a trading edge! Read on to learn more.

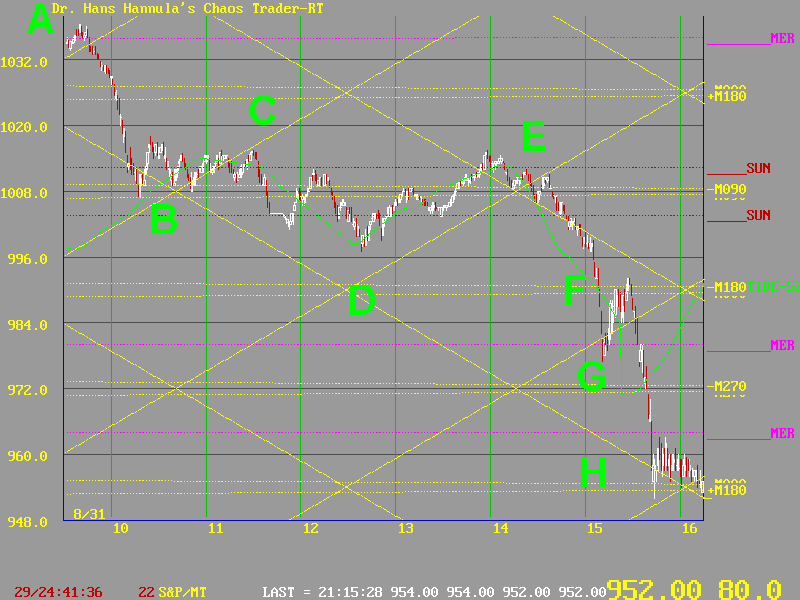
The market was strongly influenced by Mercury 0 degrees Venus. The chart below shows prices starting out on the Mercury electric flux line at A.

Prices dropped from A down to B, where they congested around the Moon -M090 and Sun fluxlines much of the day. They when from B to C, across the "diamond" formed by the sloping yellow lines, which are a high harmonic of the Moon electric field flux lines. Note that the low was at D, the "bottom corner" of the "diamond."
When prices reached the end of the "diamond" at E, they broke down, doing a "band gap energy jump" to G, catching support in the lower "diamond" at G, then being turned back down by the -M180 Moon electric flux line, They did a double band gap energy jump to the +M180 Moon line at H, closing out at the corner of the blottom diamond.
Note how the shoping yellow lines, formed by the Moon, created a downward energy channel.
Yes, there is chaos, but there is order in chaos. It can be semi-predicted, and one can CAsh In On Chaos.