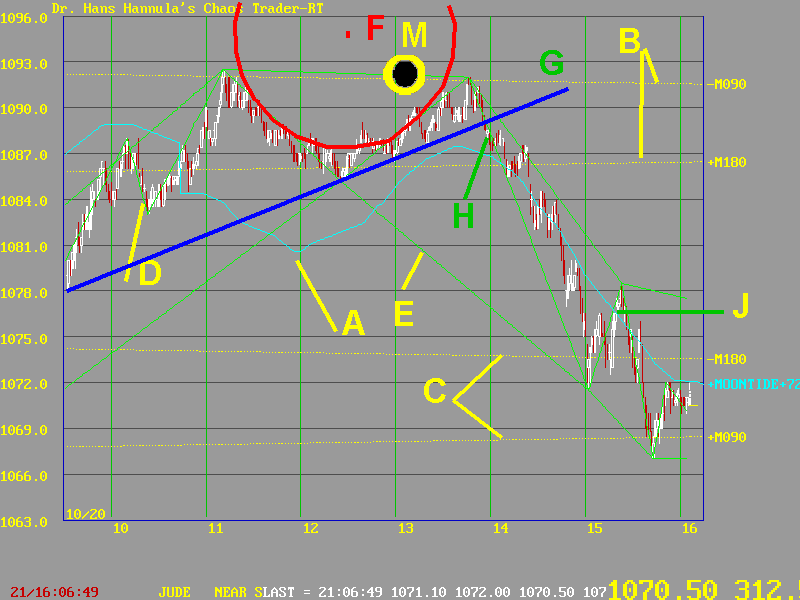

The first chart shows the S&P for October 21st, 1998. It was a day when the S&P demonstrated a principle of my Market Chaos Theory. This priciple says that markets move from one Strange Attractor/Strange Repellor (SA/SR), to another. This is sort of like the kid's "connect the dots" game. But in the market, the dots are energy concentrations. Sometimes they act like a hot stove. When prices get too close, they can't stand the heat, and they skirt around the SA/SR, like a person trying to get past the stove without getting burned. When they do this, they form a FIREBALL IN THE SKY.

The +MoonTide is shown at A. It said to look for a double top. This MoonTide pattern is a tip to look for a fireball. Further, the New Moon lined up with the Exchange at 1:06, minutes after solar noon at 1:00. This implied a high enegery level near this time.
The Moon electric field flux lines are shown at B and C. Note how they formed a "top pair" and a "bottom pair." This pattern often sets up a double top or double bottom.
The lines D and E are a swing and envelope function I use to help me fit the market action to the MoonTide pattern. The swing filter used here is a four point filter. The envelope function just connects consecutive highs or conseutive lows. The channels formed shown the major trend of the market. On this day, it was up in the morning, down in the afternoon, as forecast by the MoonTides.
The mid-day top was formed by the red fireball F. See how prices skirted aroung this "hot stove?"
Our One-a-Day trade specified the evening before said to draw a trendline a 12:30, sell a 1 point break, and trail a 5 point protective stop. It is always a challenge to make up such a mechanical trade the evening before, so it is great when one works so well. The sell came at H, and the exit came at J.
Note that this caught the "band gap energy jump" from the "top pair" to the "bottom pair" of Moon electric field flux lines. Also note that the highs were set by the -M090 flux line, and the lows by its opposite pair +M090 flux line. This setting of the daily range by the Moon is common.

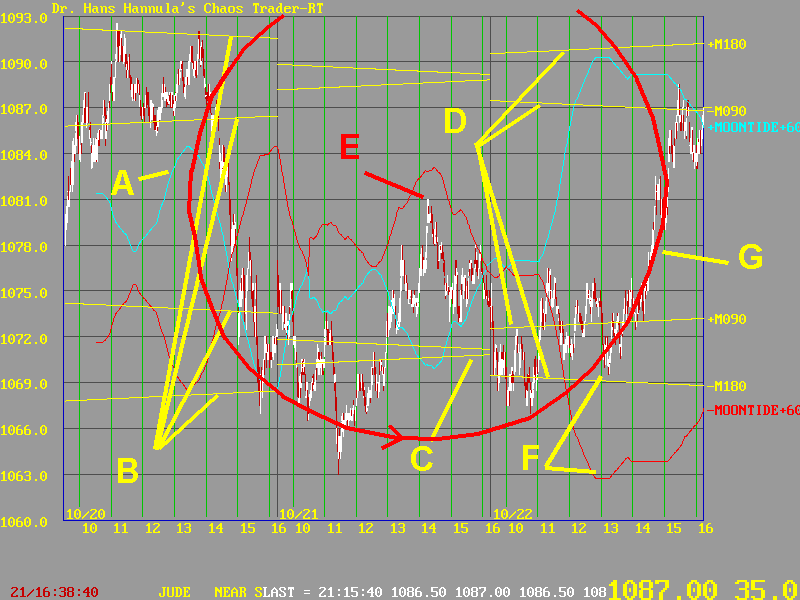
The MoonTide line shown at A called for a drop on the 20, a choppy day on the 21st, and a rally on the 22nd.
The flux lines had a pattern to them over this three day period. The "pairs" converged on the 20th (at B), pinched to a point on the 21st (at C ), then expanded after "crossing over" on the 22nd (at D).
The fireball at E covers a 49.5 hour period, during which the Moon moved about 30 degrees, or a 12th of a circle. At the same time the Earth was opposing Saturn, and conjoining Venus, while Mercury was conjoining the Moon. When there are so many things going one, the shape of the fireball can be ragged. In this case, prices moved to the center of the fireball at E, then out to the rim, to the point at F.
At this point, the rally called for by +MoonTide was several hours late. But the -MoonTide was turning up. The "swirl" of the fireball caught prices at G, lifting them sharply, completing yet another bandgap energy jump.
This swirling action is characteristic of electric fields. As electric wave move forward, they also rotate. So it is not surprising that the rotation can be seen in prices.
So look for fireballs on charts. When you see them, you are seeing the effect of energy waves (MoneyTides) in the earth's electric field.