
November 5,1998
This page shows a significant advance in the MoonTide technology. Advances in technolgy come from tenacity, patience, and hard work. I think they also come from being a user of your own technology. One thing that separates me from some others, is that I trade my own money on my theories. So when they don't work, it costs me. Keeps you focused.
My advances always come when my chart's Creativity Axis is activated by the heavens. And they were activated this week, especially by the FULL MOON.
I had a philosophy instructor once tell me that philosphy had to be like plumbing. It couldn't leak. I don't think trading theories should leak either.
To that end, I write all my own software. So if anything is broken, I can fix it. It also lets me be as creative as time allows. The next two charts show an addition to my Chaos Trader Real Time program.
I have added automatic plotting of the Moon phases as they are seen by the
rotating Exchange. This gives a great visual aid to seeing the
MoonTides, even beyond the computed MoonTide Functions. Look for yourself.
They are marked by vertical yellow lines and Moon Phase symbols. I can adjust
the height of the symbols.
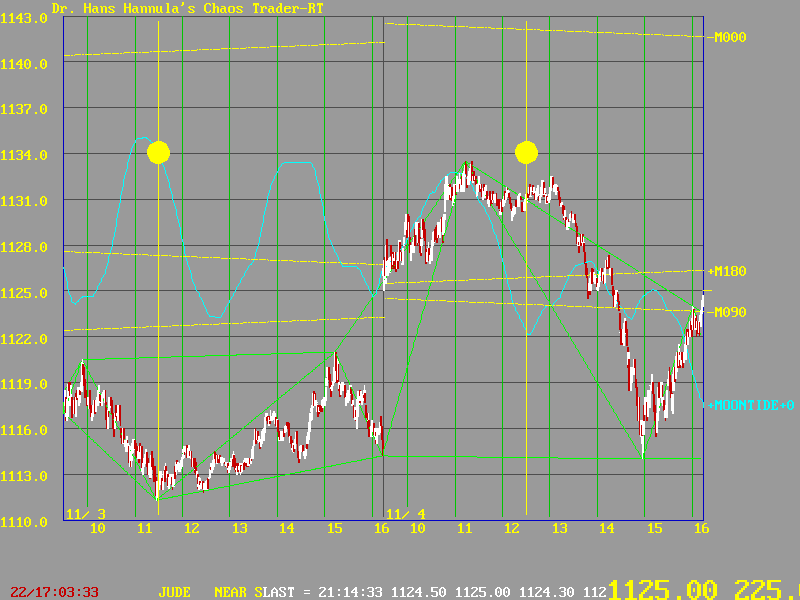
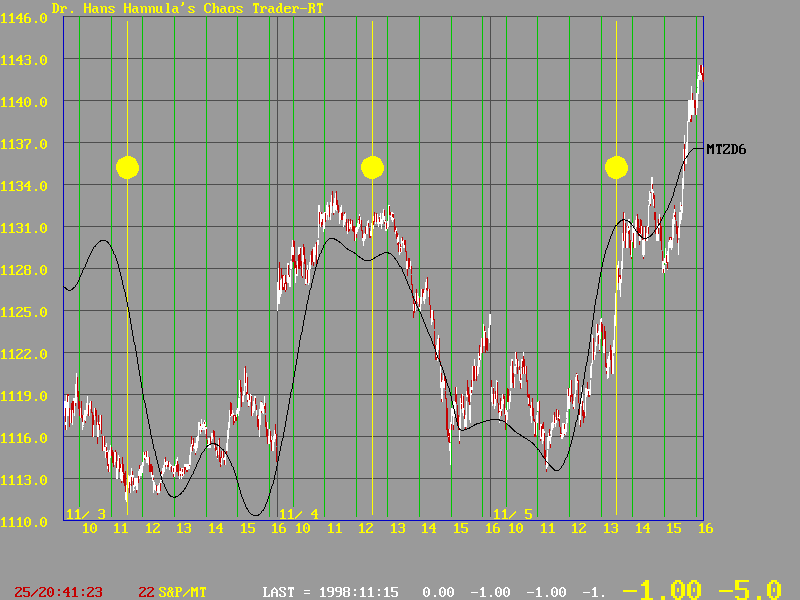
This chart shows how the Full Moon set the low on November 3rd. A secondary low came near 12:30, on the +MoonTide low. From there, the market started up. It gapped up on the 4th, and rallied more until it ran into the Full Moon again. It made a small "CHAOS CUP" around the Full Moon, then died. I caught the drop for 10 points. Nice MooNEY.
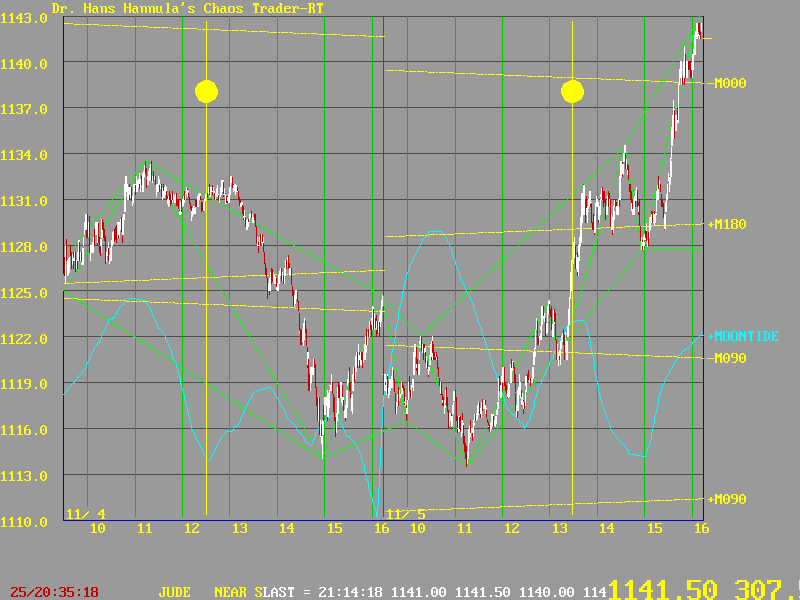
This chart overlaps the last one by one day. Look at the second day on the right, November 5th, 1998.
The forecast MoonTides marked the highs and lows well. We sold the first high at 10:30 since it was the largest swing. Made 2.5 using the One-A-Day rules. Not bad, but look at the rally that followed.
In particular, note the vertical bandgap energy jump right at the Full Moon. Awesome!
The +M180 yellow lines are the FULL MOON electric field flux lines. They attracted prices up approaching the vertical line, then repelled them higher. The crossings of the vertical lines and the electric field flux lines are the centers of Chaotic Strange Attractors/Repellors. More on that is covered in the Face of God course.
OK. So that bit of programming work was helful. But what about that big rally? Was there any way to foresee it?
YES.
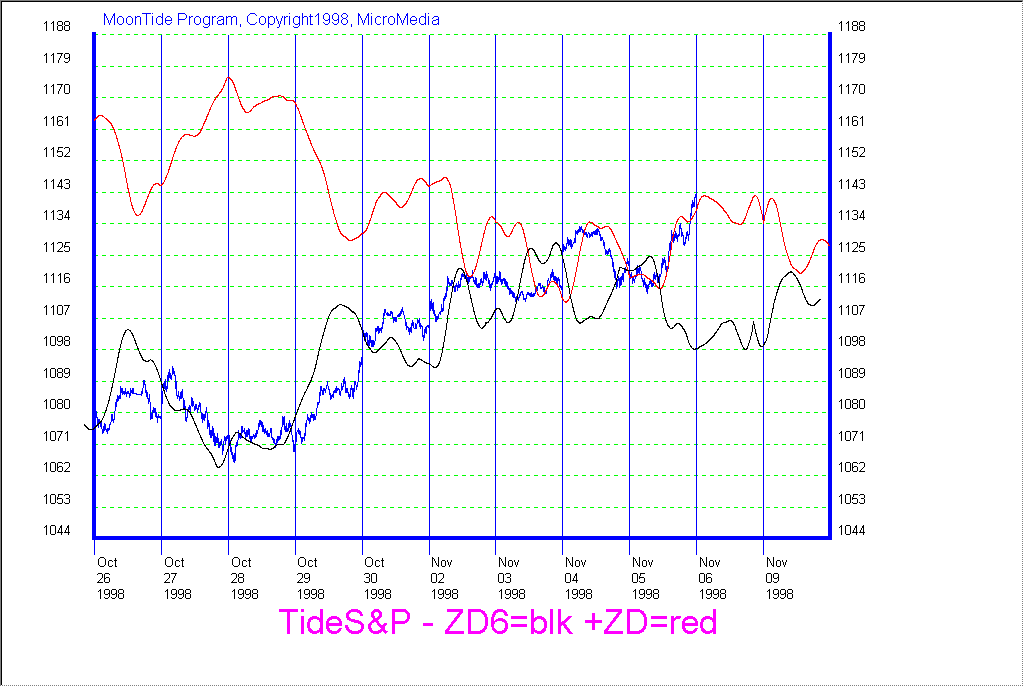
One of my many research projects, stimulated by the work of my good friend GM, has been to use my Zero Delay (ZD) cycle filter to filter the MoonTides. At his request, I added the ability to do ZD filtering to the MoonTide program. Over the past several weeks I have been doing some research with this new version.
I have found a pretty consistant set of 6 trading day fractals. They are discussed in detail in the Fractal of Pi course. So I ran the MoonTides through a ZD6 filter. I call the filtered MoonTides MTZD6.
The next chart
shows the result of using the inverted MTZD6 to forecast the several days.
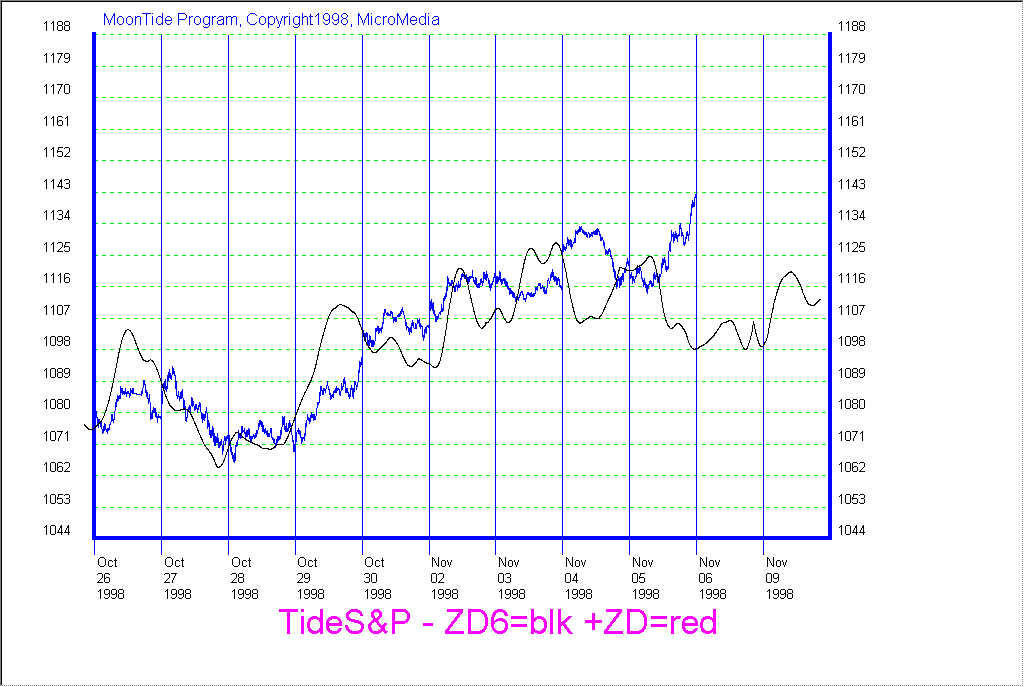
This chart looks pretty good, especially if you saw the next week. But this is a free info piece, so I haven't shown the full forecast. I have to be fair to those who support my work by buying my products. But look at the nature of the curve. It matches the major swings of each day pretty well. Neat, huh?
Now look closer. One of my hotline clients sent me email pointing out that the MoonTide ZD6 switched back to the normal MTZD6 line on November 4th. Inversions are a fact of chaotic systems, so being able to catch them is useful.
So would the normal MTZD6 hold the next day? Look at this chart.
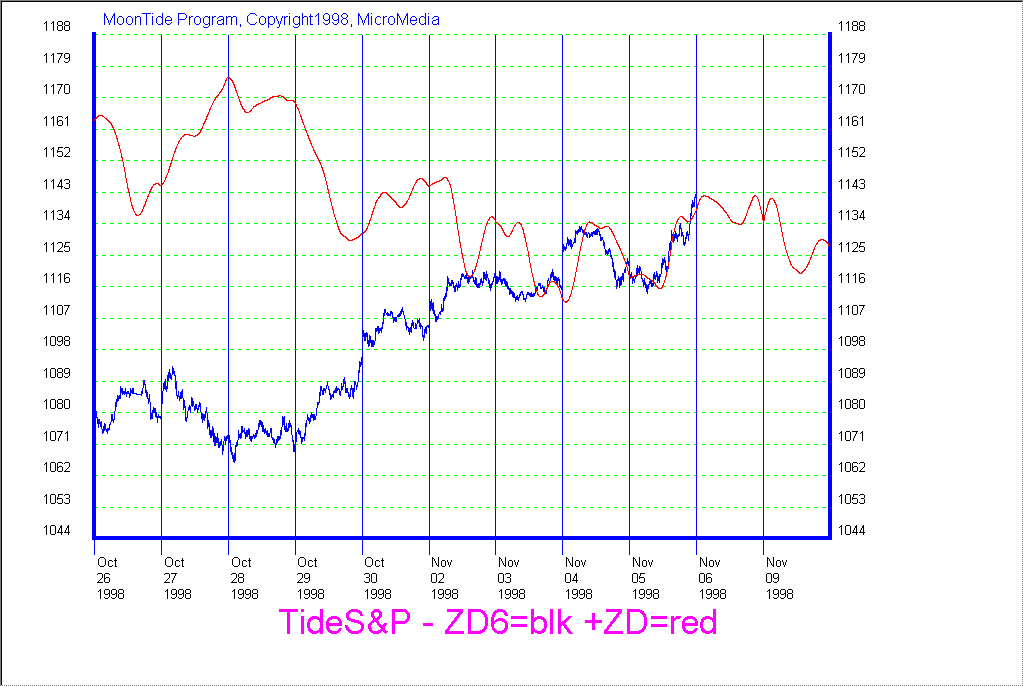
Yes, the normal MTZD6 held on the 5th. That big rally was forecast by the MTZD6. Again, some programming work paid off.
This next shart shows both the Normal MTZD6 in red and the inverted in black. One can see the Chaotic Bifurcations where the two curves cross. Note how the two started interacting on November 2nd. That was due to Mars starting it's opposition of Jupiter. Use WinGephi to see that.
So is the MTZD6 useful during the day? Take a look at this chart.
The MTZD6 was shifted back an hour and scaled. While not as precise as the MoonTides on the intraday turns, the ZD6 captures the accumulated energy from several days. One can think of the MoonTide as the energy input to the market, and the ZD filter as a model of the market. The MTZD6 is then the output of the model, which should approximate price.
I'm not done. This is a work in progress. We just work at getting better, a little bit each day. I'm thankful for this small step.
Remember that my work focuses on computing future markets by modeling the physics of the earth's electric field and the effect on traders. One value of this approach is that one can compute the tides in prices for any point in time, past, present, or future. That is what is unique about my approach. It's not an easy problem, but it keeps me challenged, makes me money, and lets me help others.
The version of the MoonTide program that includes the ZD filter will be ready in a few weeks. Past purchasers will be upgraded free. Remember, there are a limited number of programs for sale. Trading just one of those 4 hour swings well could pay for the software. MoonTides exist in all freely traded markets, so you can use the software for whatever you want to trade.
MoonTides are real. MoonTides are physical forces. MoonTides are eternal. They can be MoneyTides, too.
![]()
![]()