
December 17, 1998
Both Chaos Theory and Market AstroPhysics show up in prices. The two are directly related.
Market AstroPhysics is the study of markets as part of the solar energy system. The sun sends a steady, but not constant, stream of energy to the earth. Part of the energy consists of charged particles. These charged particles create a charged layer around the earth, called the ionosphere. It gets charged to about 300,000 volts. The voltage can swing as much as 25 percent due to changes in the solar radiation. This in turn is changed by planetary motion. The net result is that the voltage on the ionosphere has tides in it.
Those tides are strongly influenced by the moon, as computed by my MoonTides. These tides always exist as a pair. Each disturbance in the ionosphere sets up a wave going both ways around the earth. These waves affect human emotions. When you stand on the earth, a small portion of the earth to ionospheric voltage is present across your body. At your head it is about 250 volts. It causes a current about 250,000 times as strong as your brain currents to flow through your body. The waves in the ionospheric voltage show up as waves in these currents. You feel them as emotions. These emotional waves show up as waves in the buy and sell orders, and therefore in price.
These waves always occur in pairs. This makes markets chaotic. Any system that has more than one solution is chaotic.
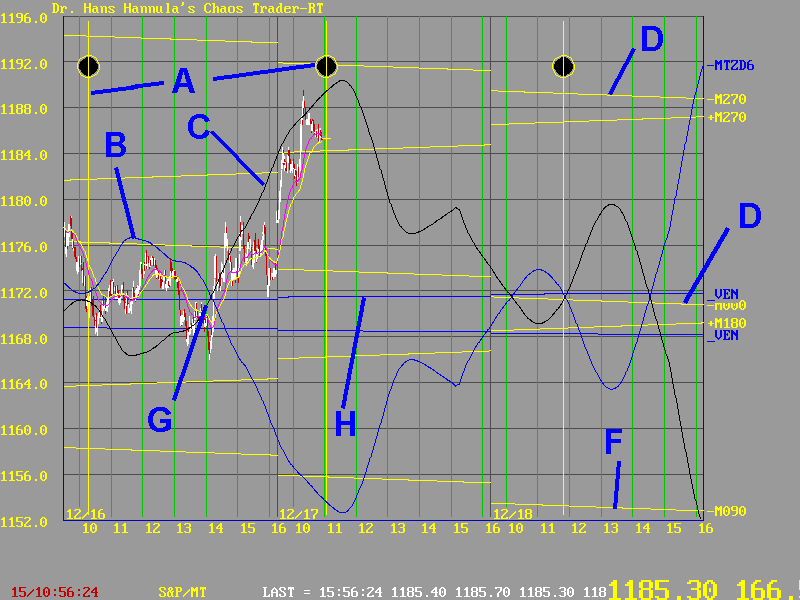
All this shows up in the chart below.

This chart shows December 16,17, and 18, 1998. The price series is the March99 S&P500 futures contract. The time point where the New Moon aligns with the exchange is shown by vertical yellow lines and black Moon balls at A. Note how the New Moon advances about 50 minutes each day.
The MoonTides filtered with a 6 day ZeroDelay filter are shown at B and C. These are the two competing energy waves. The Moon also establishes a less dynamic set of electric fields. These are shown by the nearly flat yellow flux lines at D, E, and F. Prices tend to bounce of these lines.
Point G is a chaotic "bifurcation point." This is a fancy word used by chaologists to mean "can go two ways." In this case, the market followed the blue -MTZD6 line until reaching point G, then switched to the black +MTZD6 line.
The pair of MTZD6 lines form a "fractal set." You will see similar fractal patterns in my logo and on the cover of nearly all books on chaos.
In the language of W. D. Gann, the fractal set is a "vibration" about its center point. In this case, the centerline of the set is being set by the electric flux field of the planet Venus, as shown at H.
These fractal sets occur constantly in markets. They are much more complex than the traditional patterns used by technical analysts, such as the head and shoulders, triangles, saucers, etc. Knowing how to find these can give you a trading edge. For example, this chart shows that the market could return to the balance point of the set near 1172. A properly managed short trade could work. One would cover at 1172 or on the close of the market on December 17th. Then, looking ahead, one sees this fractal set forecasting a big move in the afternoon of the 18th. So the fractal set can help you see where the potential good trades are, where there might be congestion, and where to cover. Don't get me wrong, finding these is not easy, but with education and practice, it can be done. Over the years I have figured out how the system works, how to compute the waves, and how to apply them to trading.
My firm belief is that long term trading success requires an understanding of how markets behave. I have found through years of research, mathematical modeling, and actual trading, that markets are driven by the solar energy field, and that they are chaotic. So understanding Market AstroPhysics and Market Chaos Theory are logical topics of study for serious traders.