
January 15, 1999
Last week I wrote about the critical date early in each year where the sun passes the S&P natal node. I said that we should expect a change in trend. Boy, did we get one!
I covered many things I was looking at last week. It is a good example of how much study and analysis can go into one trade. Of course, one need the KNOWLEDGE of how markets work, and what to look for. You have to learn, in order to earn.
The whole point of doing this homework is to make money. This particular event was great for our position trading hotline. But before talking about money, let's look at the energy flux lines.

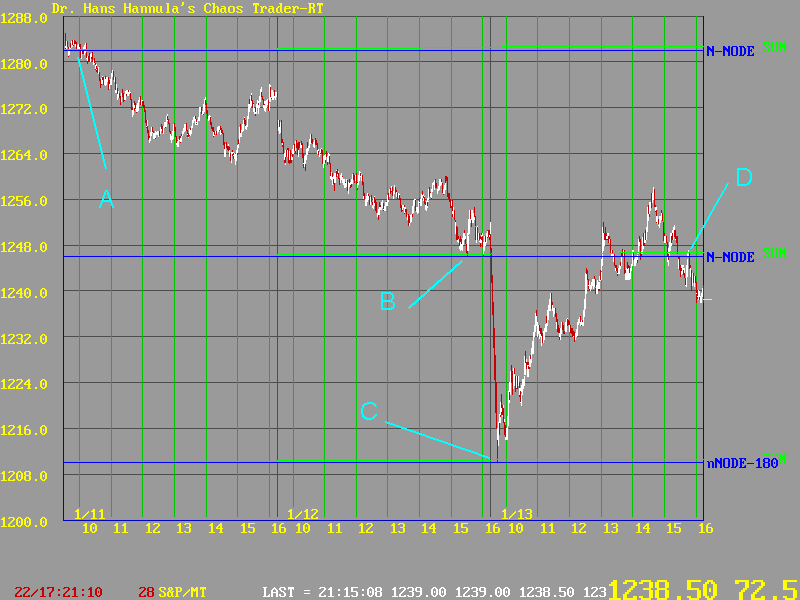
The first sign that the trend had changed came near the open on January 11th. Over the weekend, the sun had passed the natal node. Prices dropped below the electric field flux line at point A. They sagged lower all day.
On the 12, prices again declined, closing near the middle set of Sun-Natal Node flux lines at B. The MoonTides showed a big overnight move, so I warned my TOMORROW'S MARKET EMAIL S&P day traders that we might see a gap opening of more than 12 points.
So it came as no surprise when the market opened down sharply on the 13th. In fact, I fully expected it to complete a "band gap energy jump" to the lower set of Sun-Natal Node flux lines at C.
Once that level was touched, the market rallied to the middle flux line at D. All this makes it very clear that it was the Sun-Node at work. It set both time and price.
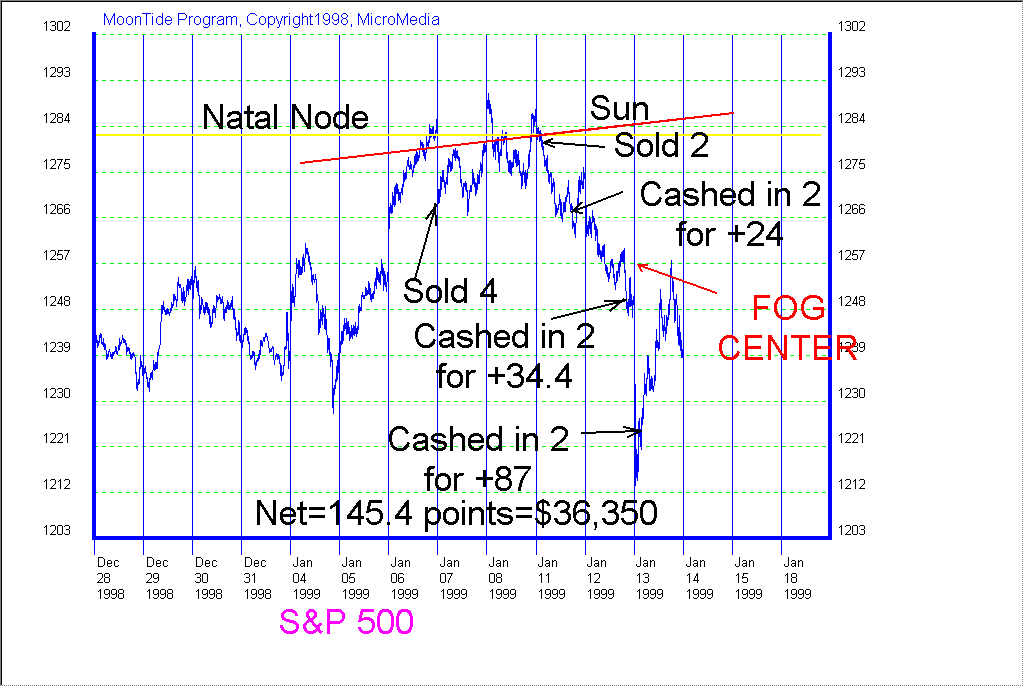
All this is very fascinating. But how about trading? This chart shows how we managed our position trading.

We actually got in too early, on the morning of the 7th. We were trailing a sell stop under the market and got elected short on the open. The market went against up all day. But knowing that the Sun was approaching the Natal Node we decided to just hold fast, with a loose stop well above the market.
The gap up opening on the 8th really concerned us. It was just below our stop. Then the market fell most of the day. We felt better when prices dropped below the 1282 level set by the natal node. But a late rally popped prices up above 1282.
Knowing that the sun passed the natal node over the weekend, we decided to add to our short position at a higher price. So we placed an order to sell two at 1280 stop for Monday.
When that stop was hit (Jan 11th), we were short 6 contracts. Since our original position was a paper loss, our first goal was to grab some money to pay for it. We got our chance late in the day. We sent out an EMAIL HOTLINE FLASH, and grabbed 12 points on two contracts for +24 points. That gave us a bit more staying power.
But things were not entirely guaranteed. With the MoonTides forecasting a big move overnight on the 12th, and being acutely aware that it could go either way (markets are chaotic because they always have two solutions) we cashed in a second set of contracts late in the day on the 12th, for a +34.4 points. So if the overnight drop went against us, we were not as exposed. And if it went in our favor, we were still in.
When the market opened down hard on the 13th, we knew our strategy had paid off. It was time to CASH IN ON CHAOS. We lowered our stop to 1224 when the market was at 1221 and falling. Minutes later we were out. Catching that vertical drop was good for 87 points.
Overall, the 6 contracts gained 145.4 points, or $36,350 before commissions. Not bad. I love multiples of 360! It is great when a trade works out like this. It takes KNOWLEDGE, DISCIPLINE, and PATIENCE.
There is one more point marked on this chart. That is a FOG CENTER. I located this Face of God pattern center the evening of the 8th, using what I teach in the Face of God course. It told me that a vertical move was probable near that center.
What is the Face of God pattern?
It is the Mother of all Patterns. Prices move from one chaotic "strange attractor/repellor" (SA/SR) to the next. The Face of God pattern is centered at each SA/SR. The pattern has lines on the left, a vertical line in the center, and lines on the right. One tries to match prices to lines on the left, working to locate the FOG center, the center of the SA/SR. Near the center, the volatility (RISK) gets low, and just after the center a vertical move (GAIN) occurs, so it is a great tool to help one find good trades (high GAIN, low RISK). It also shows you what planetary event will trigger the move.
In this case, the FOG pattern gave me the confidence that this trade would work. That helped me be patient.
It's all MoneyTides.