
May 6, 1999
Last week I reported the discovery that the Fibonacci ratios were related to lunar cycles. I asserted that these ratios would work best when they occurred near Moon electric field flux lines. It's one thing to make such a claim. It is something else to see if it stands the TEST OF TIME.
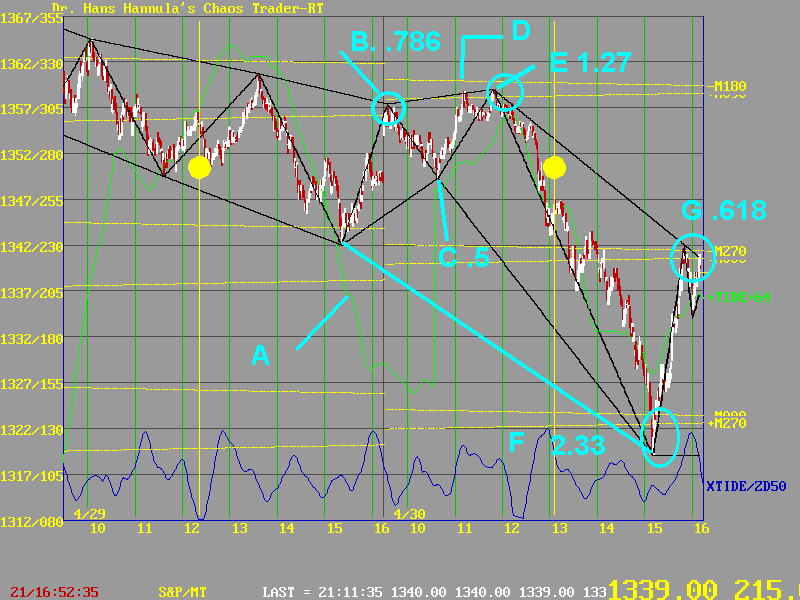
Let's start with last Friday. I forecast a BIG DOWN DAY because the FULL MOON was exact during market hours, and I expected it to set up a 4 hour drop. It did. Here's what the day looked like.

The MoonTide, shifted right by 64 minutes, is shown at A. It was very good, provided one found the shift.
The market opened on a .786 retracement, very close to the +M180 Moon electric field flux line. The market sold off, but not dramatically. It made a .5 retracement at C and rallied back up to the Moon line at D. At D the FULL Moon was exact. So this made physical sense. At E prices retested this high, making a 1.27 retracement. This would have been a good sell point, with a protective stop just above the Moon flux lines. During the Clinic, I didn't sell until 1354, when I saw the weakness as the Exchange approached the FULL MOON, shown by the vertical line with the yellow Moon ball.
Prices make one swing at the pair of flux lines at 1340. That was a 1.27 retracement, normally a sign to buy. This was, after all, a completed bandgap energy jump. But the move was not done yet. As per the MoonTide, it continued to drop.
It finally bottomed at F, an almost exact 2.33 retracement of the rally from Thursday's late low, to Friday's early high.
The ratio 2.33 is NOT a Fibonacci ratio. It comes from Chaos Theory. In chaos theory, chaotic "bifurcations" occur at a constant ratio, called the Feigenbaum ratio, of 4.669. This is a UNIVERSAL CONSTANT, like the number Pi ( 3.14.) or the number Phi (.618). The observed 2.33 is half the Feigenbaum ratio. I often see it at the end of a chaotic break, like this DOUBLE BANDGAP ENERGY JUMP.
The low penetrated below the Moon flux lines, but bottomed as forecast by the XTIDE line at the bottom. During the clinic I had covered at 1342, but resold at 1336, then covered with a trailing stop at 1326 when the prices rebounded above the flux lines.
After making that late low, the market jumped right back up to the middle pair of flux lines. This is a great example of how the S&P can turn in an instant. the rebound bounced up to almost a .618 retracement, but fell a bit short because the flux lines captured the price.
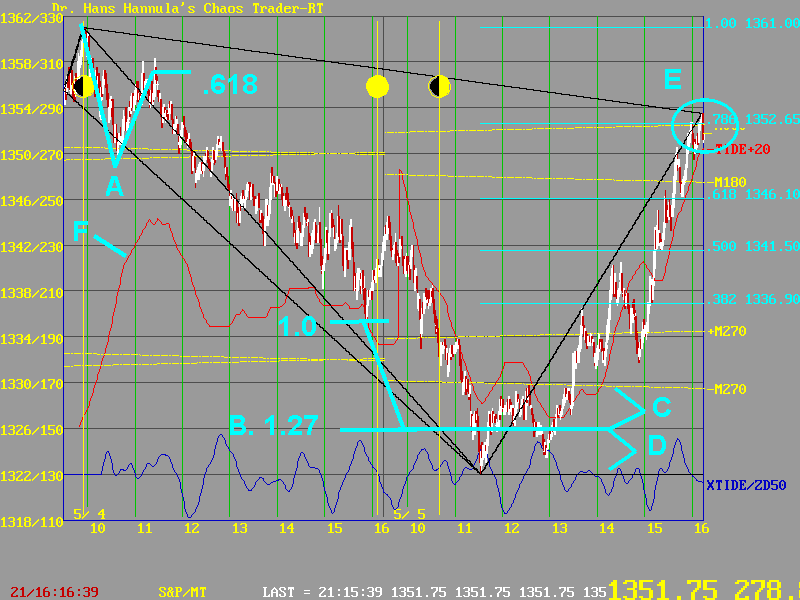
The next chart shows Wednesday and Thursday.

Prices did drop all day, but did not complete a bandgap energy jump. So I figured there was more decline to come. Taking the range of Wednesday as 1.0, I estimated a 1.27 support level at 1326.
On Thursday, prices dropped from the open, following the -MoonTide+20 minutes (red at F). So I was watching for a double bottom on the 1.27 ratio shown at B. As it turned out, this ratio was "soft." It was not near a Moon flux line, so it seemed not to be working. At C you can see that there was a "vibration" about the 1.27 that amounted to the distance between the 1.27 and the nearest Moon line. See how distance C equals distance D.
I figured out that this ratio was OK just in time to buy at 1326.75, when I saw the low at 13:00, solar noon. What a nice ride on the MoonTide going up! Although I jumped in and out on the minor swings, I caught a major part of this CHAOTIC MOVE.
When I looked at the ratios, I noticed the .786 and the Moon flux lines at 1353.5 were EXACTLY on top of each other. So I was pretty sure we would see that price before the close. We did.
I also figured that prices would open near this point on Thursday, since the Moon flux line was only slightly higher. Here's what happened on Thursday.

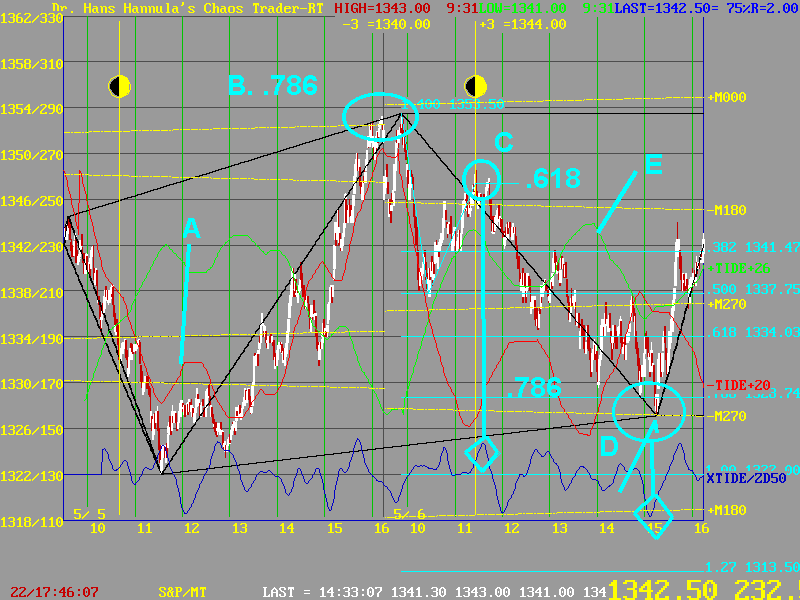
Late in the day, it looked like the market might bottom at the .786 retracement at 1329. I had told TOMORROW'S MARKET EMAIL clients to look for a buy near the 15:00 XTIDE low. But the market just wouldn't turn up. It hit the .786 just before 15:00, rallied, then dropped BELOW the .786.
Then it hit the -M270 Moon electric field flux line 4 hours ( 6th harmonic of the day) after the Quarter Moon, and JUMPED sharply. So this ratio was almost exact, and worked when the flux line was touched. That make the electicity reverse polarity.
Of course, three days of examples does not prove a new theory. But it DOES SEEM TO WORK. It gives another tool to comfirm good trades. Trade when (A) MoonTides show a turn, (B) a retracement ratio is present, and (C) a Moon flux line is present. Add in the Xtides as an aid. And ALWAYS LIMIT YOUR loss with a close stop. I don't get into a trade that I can't limit to a 3 point risk. The Moon flux lines help me do this.
This approach seems to be working. The theory is, I believe, sound. The Fibonacci ratios are related to lunar cycles ( recall 7 out of 11 in the set were lunar cycles), so use them with MoonTides and Moon flux electric field lines.
My contiued belief is that markets are physical systems, whose behavior can be understood by studying the physical phenomena underlying them. That understanding of behavior leads to successful trading. I have just taken one more step on that path. It's all in the electric field.
If you want to use the flux lines and MoonTides in your trading, sign up for TOMORROW's MARKET EMAIL. Even trading it blind with the ONE-A-DAY approach, we have a VERY NICE EQUITY CURVE. You can see it by going to the home page and clicking on the curve at the top of the page. Who knows what you could do using it with the ratios!