
May 27, 1999
Two weeks ago I wrote about Jupiter Rising turning the market down. Two weeks is half a lunar cycle, and the market has been falling. It's not really Jupiter that's falling, but it made a catchy title.
This page details the market on May 25th, 1999. It was a most interesting day. It was pretty much run by Jupiter, Mars, and the Moon. Venus got into the act late, adding to the excitement. Here are the details.

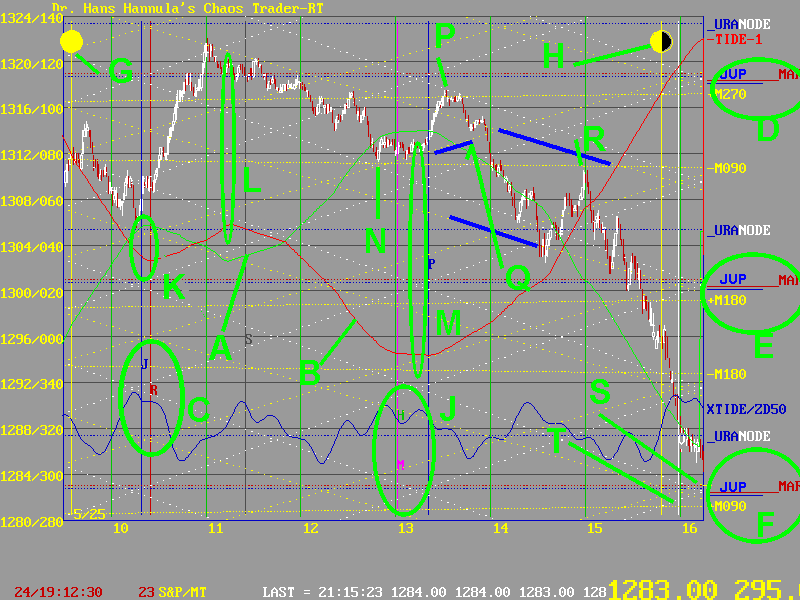
The vertical blue and red lines at C mark where the Exchange lined up with Mars and Jupiter, who were in opposition. The price levels set by their electric field flux are marked at D,E, and F. Note that these flux lines are also near the yellow Moon electric flux lines +M270,+M180, and -M090. Those "flux bundles" set the price "quantum levels."
The Full Moon was "Entering the Market" at G, while the Quarter Moon was "Leaving the Market" at H. This forms what I call a "Two Moon Day." They are frequently very volatile. The MoonTides said they would be so in the afternoon.
As the day progressed, the market looked like it was following the red -MoonTide. It made a low at K as forecast, and a high at L. The low came right on schedule at M. And just after M, the market rallied sharply. So it looked like a BIG RALLY.
But things changed at P. The +M270 flux line and the diagonal down-sloping white Exchange flux lines stopped the rally cold. At Q, the diagonal up Moon harmonic flux line was broken, and it became clear that the RALLY WAS OFF. Prices then channeled between the down-going diagonal flux lines. A portion of the channel is marked in blue.
At R prices touched and were repelled by the -M090 flux line. This was just 50 minutes before the Quarter Moon, and at the point where the green +MoonTide line was accelerating sharply.
Prices dropped sharply to the Jupiter-Mars flux lines at S. They were accelerated by the Exchange lining up with Venus, shown at T. Now, would it surprise you that Venus was also lined up-exactly-with the S&P 500 natal node?
So the Moon, Mars, and Jupiter scared the natives that day. Astrologers will also point out that Mars was retograde, making things difficult. This WAS a difficult day to trade, because the MoonTides "inverted."
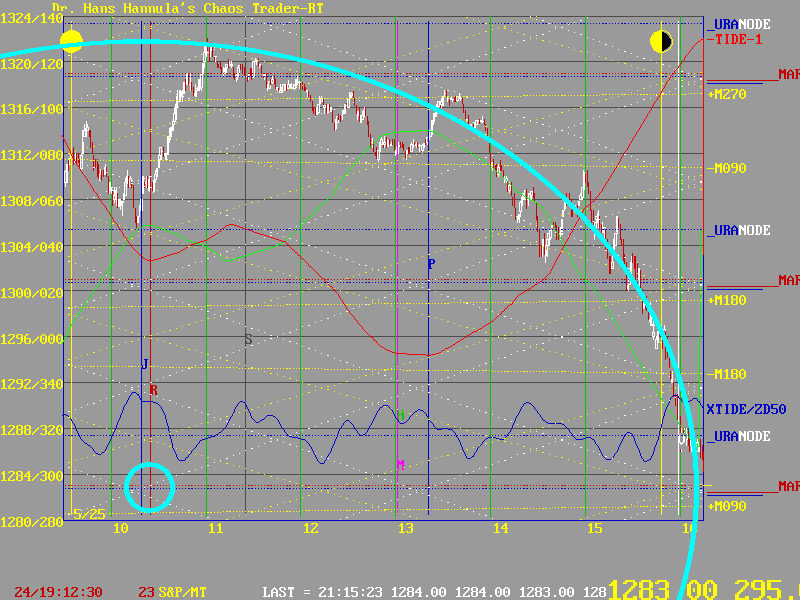
In hindsight, things look very simple. Energy fields for circular waves, and these show up as circles on properly scaled charts, or as ellipses on improperly scaled charts. The one below shows a nice ellipse.

But every day has a new lesson for me. I constantly try to figure out why things like inversions happen.

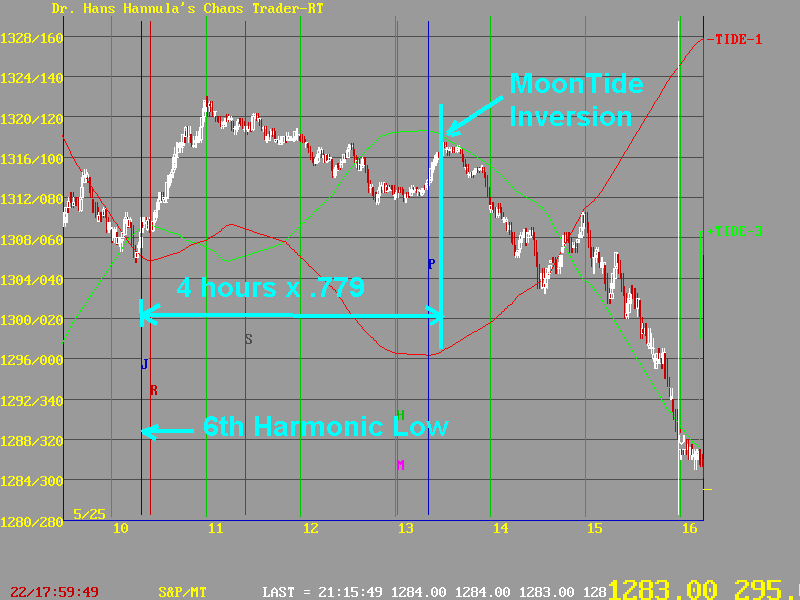
In Chaos Theory, an inversion would be a "bifurcation." These bifurcations occur in time ratios of 4.6620, a number know as Fiegenbaum,s constant. My research as found that this constant shows up in markets as a ratio of 4.6692/6.00=.779, both in time and price. Knowing that the S&P likes to run on the 6th harmonic, which means 4 hour swings ( 6 per day ), I looked for a Feigenbaum bifurcation at 3.18 hours after the low. Bingo. There is where the inversion occurred.
Remember, that was at point P in the first chart, where prices hit the Moon electric field flux line. So it was the MOON that triggered the inversion, at a critical time, set by the Fiegenbaum ratio.
This does not prove a hypothesis. One needs many more examples. But every breakthrough starts with one careful observation and a connection to theory. This may well be one.
Remember, everything happens for a reason.