XGO Chart Samples
|
We now deliver our XGO Energy Forecasts in Adobe Acrobat PDF format. They can be read with the free Adobe Acrobat reader. If you don't have it, you can download it from Adobe's website.
For each market, you get 8 charts:
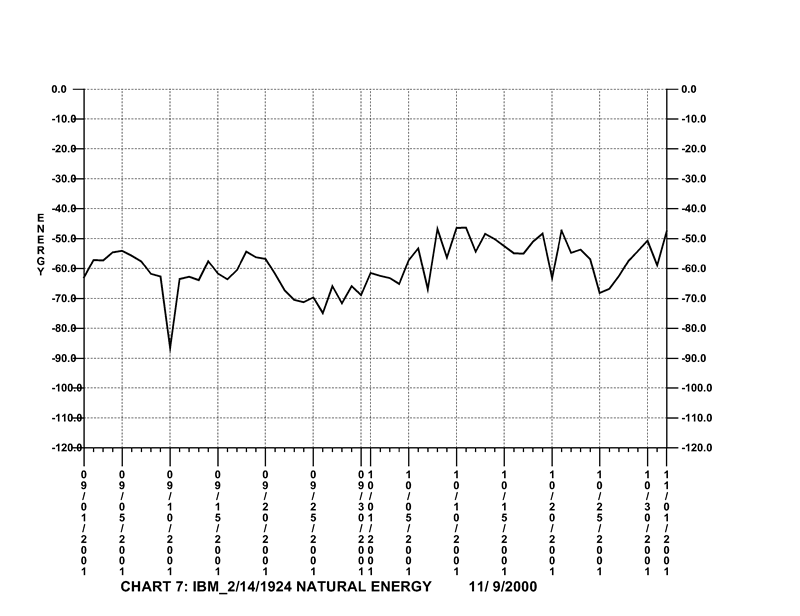
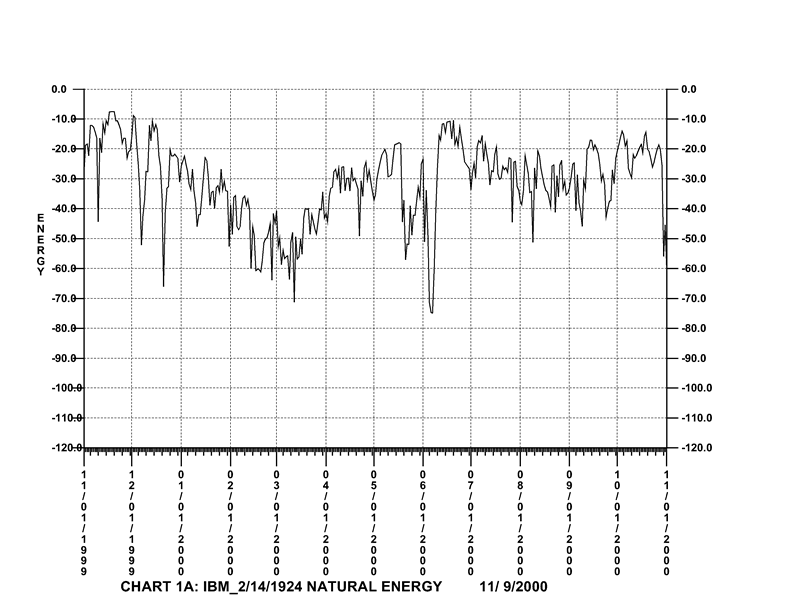
All of the above is for the one price of $36 The charts look like this. These are for IBM using the first trade date by Bill Meridian.
Past Year Your XGO ChartXGO computes the energy being received by a person or market from the universe. This represents the Joy-Gloom curve of the entity. The numbers are negative to indicate the flow into the entity. The higher the number ( lower on the chart ), the more energy being added from the universe. XGO lows are periods of "battery charging." During those periods a person is being "reverse charged" like an electical battery. It is a time to do simple tasks, relax, and accept the energy from the universe. It is not a time to attempt tasks that require spending lots of energy. It is also a time to be careful. Accidents happen on XGO lows. Princess Di died on an XGO low. I fell and broke my wrist on an XGO low. During the rising part of a curve, you can expend energy. On the peaks, you will be at your best. This is when to do those things that are challenging. Your extra energy will aid success. The average level of your chart is your baseline. A baseline high on the chart ( such as - 30 ) means you are more connected to mundane things. A baseline low on the chart means a more direct connection to the universe. This may show up as a more spiritual outlook on things. The size of the swings about the baseline is a measure of your volatility. Sharp wide swings may feel like an emotional roller coaster. Very tiny swings may feel boring. Two people's XGO charts can be compared to see how they match over time. Compatible couples will have similar, but not necessarily identical patterns. Markets will tend to follow their XGO charts. This makes them very useful for trading. Further, people will be attracted to stocks or markets that have curves much like their own. This is mutual attraction. You should not own a stock or trade a market whose XGO chart is very different from your own. The average level of your XGO energy can be increased by using an energy charging kit. Other techniques, such as meditation, or a hobby can be helpful. Remember, it is natural to have ups and downs. It's all in your XGO function. Check out your personal XGO. Use it to plan ahead. Get XGO charts for all your markets. Use them to select your trades. Have fun! |
 Next Year
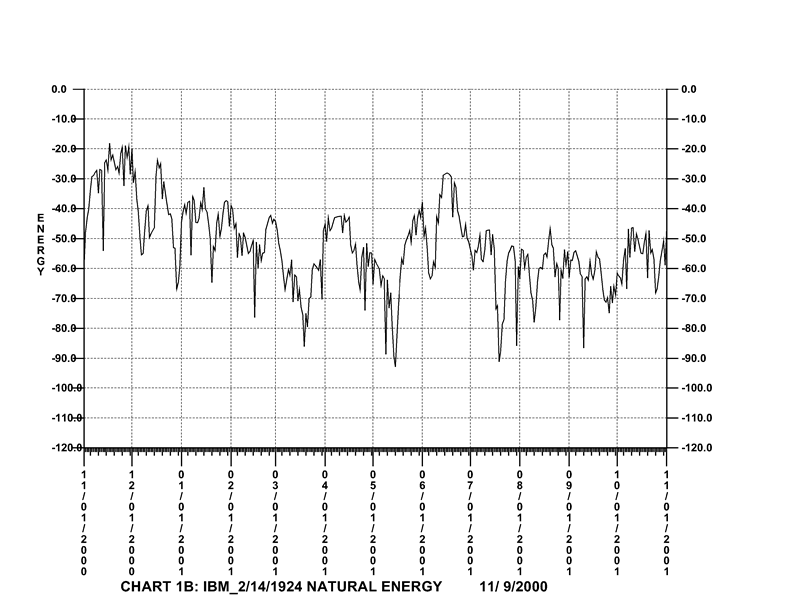 Next two months
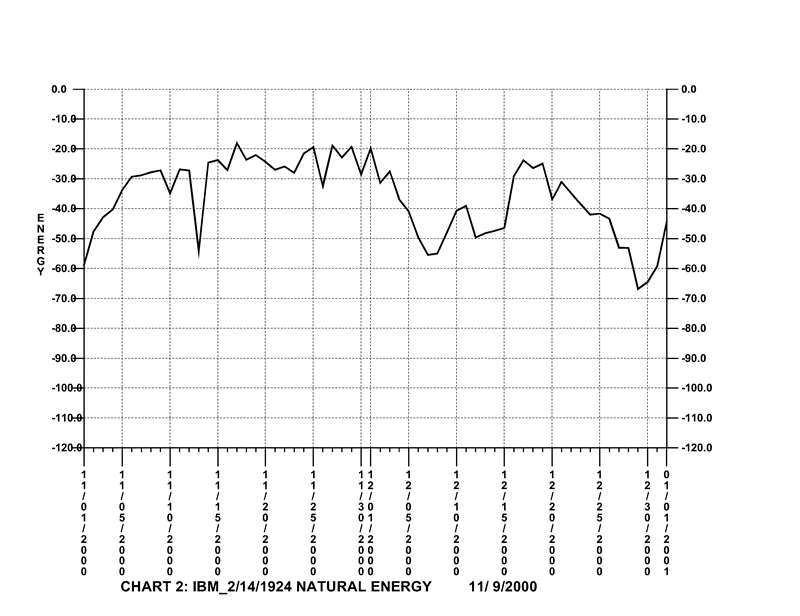 Months 3&4
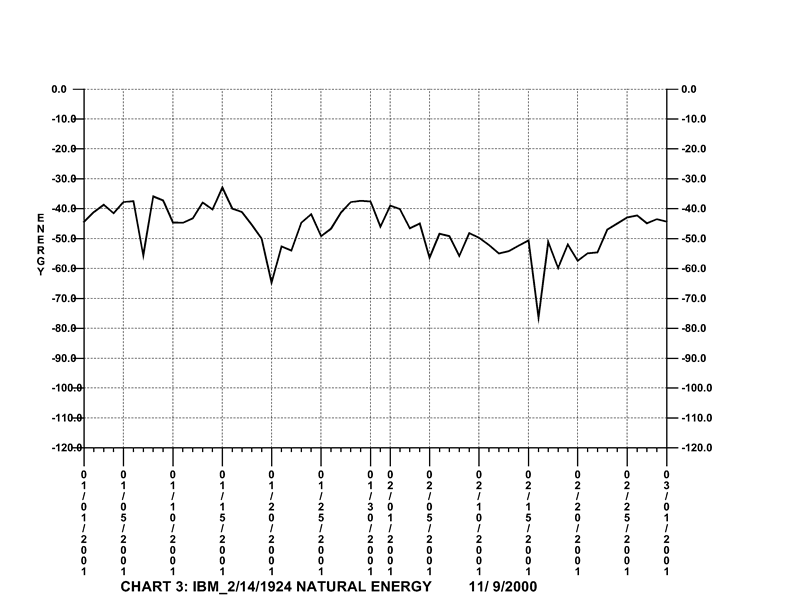 Months 5&6
 Months 7&8
 Months 9&10
 Months 11&12