
Chaos Clinic from 02/01/2002
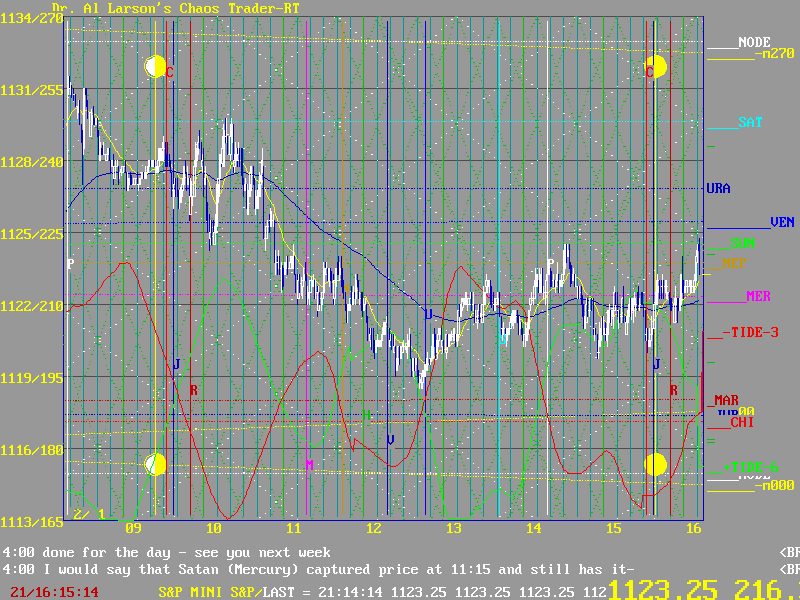
This is the chart

These are the comments made during the live session
4:00 done for the day - see you next week _______________________________________________________
4:00 I would say that Satan (Mercury) captured price at 11:15 and still has it-__________________
3:45 stopped out 1123 - resell 2 1123 -Cover on close___________________________________________
3:32 I was wrong earlier-this is "Tuesday" of our scaled fractal______________________________
3:22 don't leave yet-still have the big Jup/Chi/Mar/Moon pattern at the end of the day_________
3:18 Now we are moving into "Tuesday" in our scaled fractal __________________________________
3:15 This chart looks just like the 9 day chart did end of Monday-fractal self simularity______
3:04 I shifted +Tide left 36 minutes as if Moon/Jupiter time lines pulled left_____________
2:56 sell 2 1120 stop 1123___rolling right late in day _____________________________________
2:53 don't like my longs - cover 1121 --faled to rally up the minor grid double line________
2:51 See the letter M pattern, sloping up - M is for Money_ a buy setup ____________________
2:49 that dip was from the Xcgh squaring the Moon's Node-must rally here_____________________
2:43 at 2:59 Moon squares Jupiter-should make 3:00 a "resonant hour"_______________________
2:34 looking good-should make it back up to the Saturn 1129.5 flux - cover there_____________
2:26 I have highlighed the double grid line in the minor grid in yellow-prices could climb it_
2:13 bought 2 at 1123 stop at 1120 -green +Tide appears to have won_________________________
2:06 make buy stop buy 2_____________________________________________________________________
2:01 sp2day chart looks good-check it out ___________________________________________________
1:59 place buy 1123 stop_____________________________________________________________________
1:55 cover the one I bought 1123 at 1121.5 for -1.5-have sell 2 1120 stop in_________________
1:52 approaching a "chaotic bifurcation point" -+/- Tides balanced now, but separate soon____
1:46 long 1 from 1123 stop 1120 - make that at sell 2 to reverse if hit______________________
1:44 sharp dip as Xcgh squares Saturn - cover the one I bought at 1121 for 0 ________________
1:35 this white diamond ends 1:55-tides show next diamond has a streak move__________________
1:32 getting up energy now-buy another 1123 stop 1120________________________________________
1:29 this could be a buy signal failure, since prices stalled-bouth 1121 raise stop 1120_____
1:16 now see blue 110 EXMA curling up, and yellow 20 min EXMA about to break it,a buy signal_
1:12 bought 1121 stop 1119 holdnote "down diagonal diamond" channel now BROKEN-______________
1:05 low came as Moon Squared Chiron-may be geetin a green +Tide low-hold long_______________
12:57 stopped for +1 - buy 1121 stop 1119 -assume on red -Tide______________________________
12:55 got a litttle lift as Exchange passed Uranus-possible inversion-lower stop 1121_______
12:42 sold 1122 lower stop 1122 - Look at Nasdaq 2 day chart. 1ADAY trade set up on it______
12:33 sold 1122 lower stop to 1123.5 ________________________________________________________
12:30 trend still down- coming to the steep drop in green +Tide______________________________
12:05 If you are logged in, look at the Wheel of Fortune-Price Square A= a streak.A 180 M ___
12:00 if you look on the AUX page, you see that Neptune was hot on the close yesterday_______
11:58 sell 1122 stop 1126 - this is a congestion, not end of move____________________________
11:46 cover 1122 for -.25 don't like it - stopped at $90Time on Neptune_____________________
11:40 rally should go to 1125.25 by 12:18, where price squares time by Venus_________________
11:29 buy 1122.25 stop 1121-for small rally on +Tide_________________________________________
11:23 Price squared time at Mercury-on green Tide, so cover 1122.5 for +1.5 __________________
11:04 Saturn flux set the high-Exchange squares Saturn 1:40, near green +Tide low______________
11:00 picked up 12th Harmonic off of Mars and Saturn, so move about 2 hours or more__________________
10:54 sell 1124 stop 1128-110 turning down, and diamonds forming a down channel_______________
10:49 If you access the Member's Only portion, you can see the Wheel of Fortune_______________
10:49 It shows price square Venus and Sun-sets up 6 hour cycle or congestion period_____________
10:45 covered 1126 for -2 _____________________________________________________________________
10:39 Coming to the corner of the diamond-if don't move up soon I'll kill my long______________
10:35 stuck in at trading range-horizontal diamonds, 110 EXMA flat-____________________________
10:27 still flat-I think the red tide is in effect-___________________________________________
10:15 buy 1128 , stop 1124 - switched to 1 day screen with S&P Harmonic Grid___________________
10:05 does not look like the 1ADay trade will setup-it was looking for rally over 1135_________
_______________For access to the Members only part of the site, click on [List of charts-...]...
9:55 now starting to rally - looks like on green +Tide________________________________________
9:35 Opening flat-1ADay watching for early rally,as a short setup______________________________
9:35 __________For access to the Members only part of the site, click on [List of charts-...]...
9:10 Good Morning from the Chaos Clinic at Daytradingforecasts.com_____________________________
_______________For access to the Members only part of the site, click on [List of charts-...]...