![]()
![]()
********************************************************************************
젨젨쟃old Is Looking Bright
젨젨잺haos Clinic for 12/6/2019
********************************************************************************
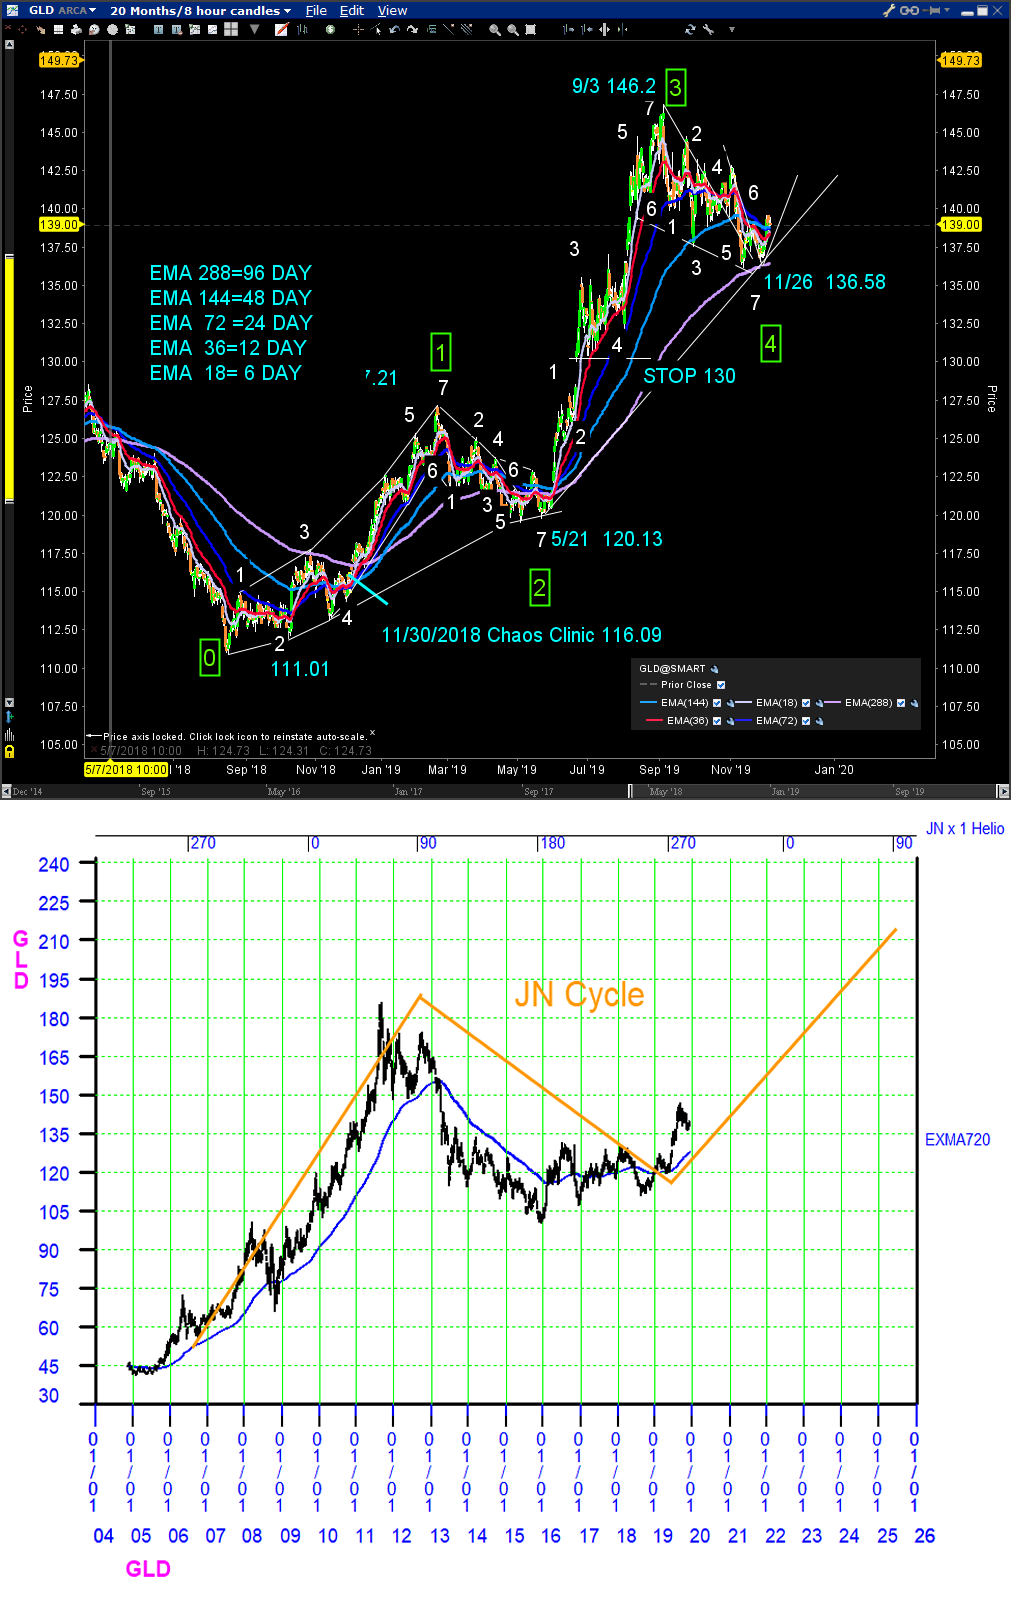
My 11/30/2018 Chaos Clinic pointed out that the gold Exchange Traded Fund GLD
looked like it was going to rally. Now, a year later, it is poised to rally more.
The top chart shows an 8 hour bar chart covering 20 months. For the move starting at
point 0, prices have traced out moves 1, 2,3, and now 4 of 7 in an up Chaos Clamshell.
Inside each of these moves are smaller 7 move fractals.
A rainbow of exponential moving averages helps indentify moves. On this chart the 288 bar
EMA filters a 96 day cycle. At move 2, this average was penetrated slightly, but at
4, prices have held above the 96 day EMA. This helps confirm move 4, and also indicates
that the move is gaining strength.
The second chart is a multi-year daily chart of GLD. Overlaid on it is the 12.8 year Jupiter-Neptune
astro cycle.That cycle shows up as a square in the US gold futures natal chart. The turns
are on the squares of the cycle. That this is a valid cycle is shown by the behavior of the
720 calendar day tracking EXMA.
Traders should proceed at their own risk. Stops should always be used. The EXMAs provide
stop guidance. On the top chart, a stop under the 96 day EXMA should work,and on the second
chart, one under the 720 day is advised.
Chaos Clamshells are taught in my Cash in On Chaos course.
A free online mini course called Trading The Chaos Clamshell
can be found at
http://moneytide.com/hans/institute.asp
For more on my work, see Moneytide.com
12/6/2019 10:48:25 AM MT Al****:: I'm going to call it a day. Thanks for coming. Have a good weekend. Take some courses.
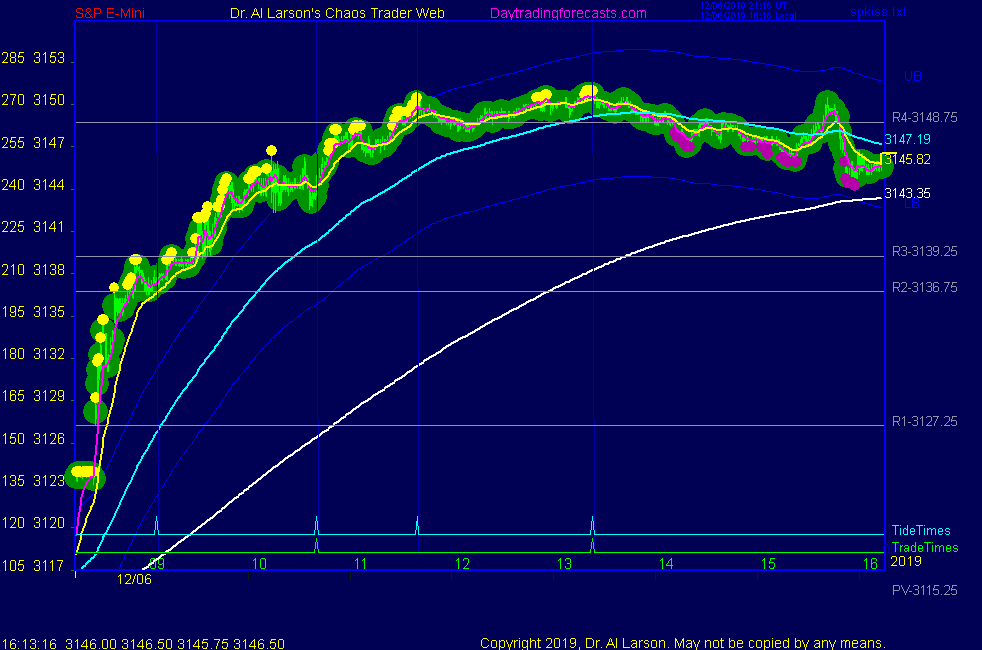
12/6/2019 10:30:17 AM MT Al****:: if prices close flat or lower from here, the weekly candlestick will be a "Hanging Man", a topping pattern.
12/6/2019 10:14:46 AM MT Al****:: for the week, prices have made a volatile "V" pattern, telling me the bears and bulls are about equal. My Secret->Daniel chart
tells me Monday could be volatile
The Secret->esNat72 chart show the rally has gone up 3 yellow vibration levels, so prices could stall here
12/6/2019 10:06:47 AM MT Al****:: there was a continuation buy near the 10:41 MoonTide trade time, good for about 4 points; the rally has reached R4, where the computers usually cover.
12/6/2019 9:41:06 AM MT Al****:: thanks TG. That book was an eye opener for me.
12/6/2019 7:51:50 AM MT Al****:: restarted them; good now
12/6/2019 7:44:16 AM MT Pre:: Chaos Clinic and XPTide2 charts aren't updating.
12/6/2019 7:41:32 AM MT Al****:: SPXTide2 charts are a different mathematical model. They do not work as well over time as the original MoonTides
12/6/2019 7:41:02 AM MT TG****:: Good Morning AL, I enjoyed your story. I don't recall you sharing that in the past 16 years or so that I've been following your work. Glad you decided to stick around all these extra years. I bought "Journey of Souls" per your recommendation.
12/6/2019 7:30:15 AM MT Pre:: What's the difference between the SP XTide2 charts and the +/- tide charts? Do the turning points in the SP XTide2 charts have any significance like the do with the regular +/- Tide charts?
12/6/2019 7:25:10 AM MT Al****:: Everyone should read the book "Flash Boys" so you understand how they trade. They use fast computes colocated in the same racks as the exchange computers. They trade in milliseconds. A long term trade for them is 7 minutes. If you can catch one of their runs,fine, but don't hesitate to take a profit while it is there.
12/6/2019 7:13:48 AM MT Al****:: I don't call trades in real time. 9:07 is a Tide time, but it is not a MoonTide Trade Time. The first trade time is 10:41
I don't like going counter the trend and try not to fight the Flash Boys. I usually don't trade
the employment report, but today I did, by placing using the
Secret->esnat72 chart. Before the announcement I placed a buy
stop at 3126.75. It got filled at 3125.25 I covered at 3132.5.
I did this with a one minute chart on NinjaTrader8 using the
Chart Trader.
12/6/2019 7:03:18 AM MT mjh:: surely it means go long the tide is up
12/6/2019 6:57:20 AM MT Pre:: So with the big spike we just saw with the unemployment report does this invalidate the 9:07 moontide signal or should we go short at that time?
12/6/2019 5:53:14 AM MT Al****:: Thanks Ted. Kind of you to say so.
12/6/2019 5:08:32 AM MT Ted:: Thanks for everything Al! You have certainly been a blessing over these last 20 years... the knowledge you have acquired and revealed is amazing. God bless!
12/6/2019 5:06:31 AM MT srt:: Hi Al your take on sp500 and VIX?
12/6/2019 4:54:35 AM MT Al****:: GM all. Good luck today. Chaos Clinic is posted on the AUX page.
9:00 Eastern-System: No comments
![]()
![]()