
|
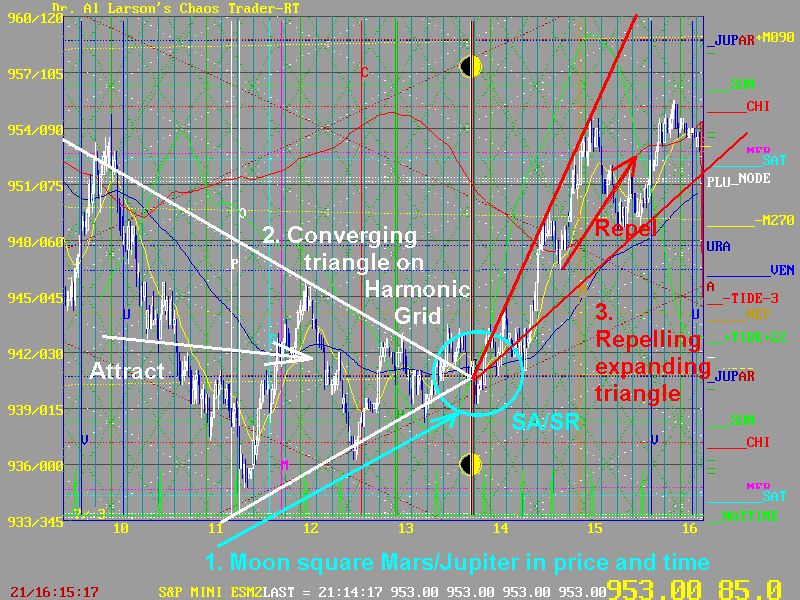
Written July 3, 2002 The market fell like a rock this week, but make a nice low today as the Moon squared Mars conjoining Jupiter. This S&P Harmonic Grid chart shows what happened: 
At 1, you see how the Mars/Jupiter/Moon electric flux and time lines formed the energy center of the day, a chaotic Strange Attractor/Strange Repellor. You can see how prices were attracted to the SA/SR in the white attraction cone at 2. Then after the SA/SR, prices blasted higher as they were repelled. I did see, understand, and trade this pattern. I went long just after the SA/SR at 942 and covered at 953 on 3 contracts. That's 27 points, or $1350 before commissions . So knowing my Market Astrophysics and Market Chaos theory paid off nicely today. It's a great way to go into a holiday weekend! Study-understand-learn-earn-ENJOY!
|