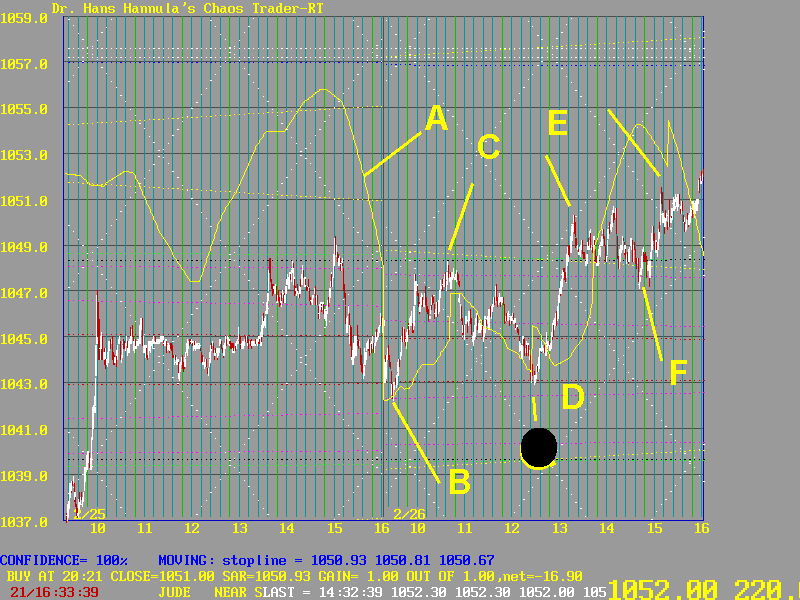


This chart shows the moon on the solar eclipse of Feb 26,1998. The yellow line A is a moon energy forecast, similar tho SP.IXGO. The day began with a bounce off of eh Mercury line at B. Prices Then ran up to the Moon line at C, and sagged into the New Moon (filled black disk) at D. At that point the eckipse was exact and the low had been tested, and the forecast was for a sharp rally. It occurred at D to E. This is a STREAK, as discussed in my Fractal of Pi course.
At E prices hit the white Exchange line, which stopped the streak and let prices be "captured" by the yellow dotted moon line. At F, where the moon function shows a sharp "jerk," prices jerked upward and closed higher.
This pattern is eseentially the same as seen in the two previous examples of THE MOON IN ACTION. The only difference is whether the moon is the full, new, or quarter moon.
Will this pattern repeat a fourth time? Join us on March 6th to find out.