
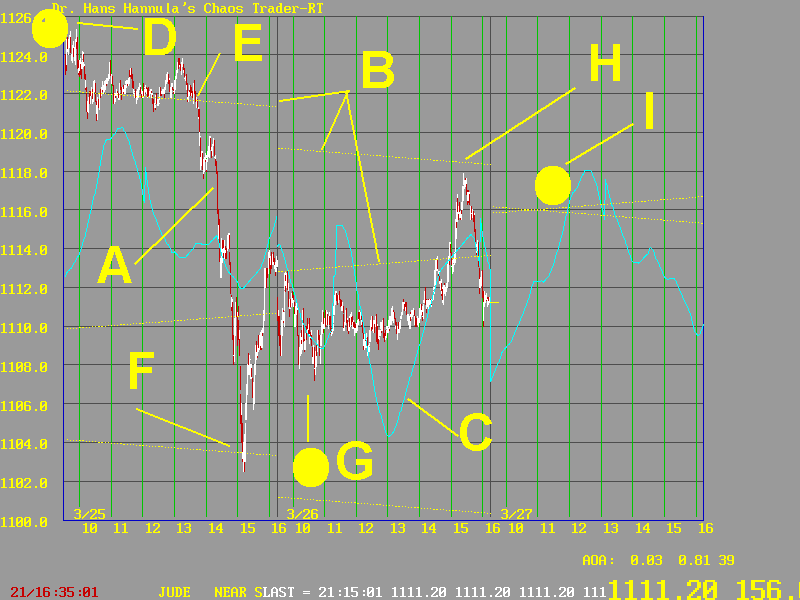
This chart shows the setup going into the New Moon of Friday, March 27, 1998.
Two days of price action are show with red and white candelsticks at A. It's been "luny."
The Moon electric field flux lines are the slightly sloped dotted yellow lines as at B. There is a down coming set ( the negative field) and an upcoming set ( positive field). They converge March 27.
The cyan (light blue) line at C is the inverted S&P 500 moon function. It is my calculation of the moon energy being recieved by the S&P 500. Prices have followed it fairly well, especially at the turns.
The big drop March 25 was a Moon-to-Moon "band gap energy jump". Prices "arced" (as in arc welding) from point E to Point F. Each was a moon field flux line. The action began with the New moon at D passing the Exchange at the market open at D. The March 26 low was at G, again where the New Moon passed the Exchange. That sent prices up to the moon field flux line at H, which sharply repelled them.
All this helps anticipate the action on March 27. Unless the moon function inverts, prices should be pulled up toward the New Moon at I, then turn down into the close, possibly sharply.
That fast move A is a STREAK, as covered in the Fractal of Pi Course. There are more coming, thanks to DA MOON.
![]()
![]()