
JUNE 10, 1999
There was a rising sign this week, and it did what many rising signs do-it brought a down, chaotic market.
I did get up a 4:00 AM to photograph this sign-but the weather in Denver was overcast and raining. We have 300 sunny days a year, and only 65 that are not. This was one of them. (Yes-Ace did get up and go with me, so at least he got his morning run in the park.)
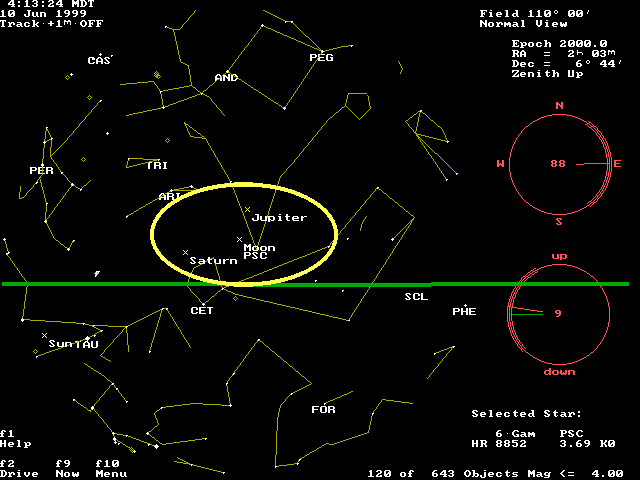
But, thanks to my computer, I can show you what the sign looked like. This is the screen from my astronomy program.

Remember how Jupiter rising dropped the market a month ago? Now here it is again, but close to Saturn as well.
That's the physics. If you believe my thesis of Market AstroPhysics is right, this rising sign should be seen in today's market action.
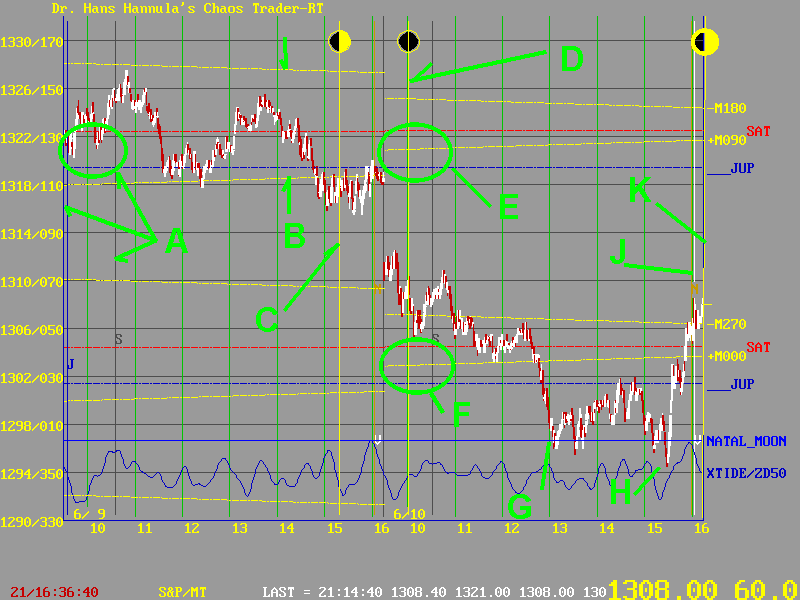
Below is a chart of the June S&P futures contract for yesterday and today.

Prices did not react to this box. They spent the day vibrating about the red Saturn line, which was nearly centered between the -M180 and +M090 moon electric field flux lines. At C, you see where the Quarter Moon passed the Exchange. Prices closed near the Jupiter line.
They stayed there overnight-they were there until just before sunrise, when the rising sign moved above the horizon. At E is the same Jupiter/Saturn "energy box", but now the New Moon has "activated" it. But the box at E is 90 degrees, or square the rising sign. The actual energy is 18 points lower, at F. And that's just where prices headed. Much of the move was over before the open outcry session even began. The rising sign had done it's work. The New Moon had "come into" the market with style.
Prices moved lower at G, as the Exchange passed the Sun. The price level was right on the S&P Natal Moon, which often is a support level. There was a late dip at H, right where the XTIDE ( "rumble of the rotating earth") energy said it should be. Then prices jumped sharply, as the Exchange lined up with Venus exactly conjunct Neptune at J, and the "departing" Quarter Moon at K. So prices followed a Moon-Noon_Moon pattern after the rising sign.
There is more to see, too.

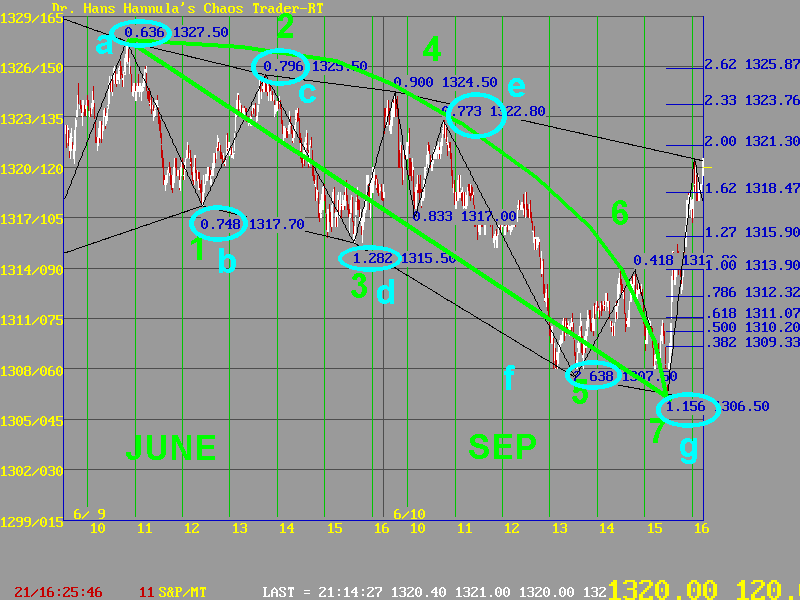
This chart is a "brute force" continuation chart. The June contract is shown for yesterday, and the September for today. Even when prices are fit together this way, they form recognizable patterns. That's because prices are in the trader's minds, and they may not mentally shift gears when they see a new contract.
This chart shows the down Chaos Clamshell of 7 moves. This was a pretty easy pattern to recognize and count the moves. More advanced forms of this pattern are taught in the Cash In On Chaos course and the Fractal of Pi course.
These patterns create points that can be recognized by looking at the swing retracements. The retracements tend to follow Fibonacci ratios, or their square roots. I have recently found that the square root ratios are related to the Feigenbaum ratio of 4.6692 from chaos theory. So while we see .618, 1.618, etc., I especially watch .786 or it's Feigenbaum neighbor .779, and 1.27. I call these "Chaos Ratios." In the points marked, a is near .618, while b, c, d, and e are all Chaos Ratios. Point F is 2.618, a Fibonacci ratio. Point g is another Chaos Ratio - one that is not related to the Fibonacci ratios. It is related to the Fractal of Pi, and is ideally 1.0909. It can be very powerful as illustrated here.
That power comes from the energy fields. The next chart shows a bit more.

The New Moon sets the -M180 flux line. This line acted like "downward resistance." See how it repelled prices a D and E? That was a subtle clue that the Rising sign would drop prices.
The drop was down to the -M270 flux line - EXACTLY. When prices hit it at G, the "bandgap energy jump" triggered by the rising sign was done.
It all fits together. Chaos has an underlying order to it. So be aware of the Signs in the sky, and watch the Moon in Action. You will be amazed at what you can see- even when it's overcast.