
JUL 15, 1999
Two weeks ago I wrote about the RISING SIGN WARNING of a sharp drop. IT DID COME. On our CHAOS TRADER'S HOTLINE we worked it for 222 points in the S&P 500 ($55,500 before commissions). We started establishing a short position last week. The market moved marginally higher, but not to our stops. Then last Friday at the end of the Chaos Clinic, my analysis said that THIS WEEK WAS it. So we doubled our short Monday morning, caught the drop, and on Tuesday we CASHED IN ON CHAOS. No, we did not get all we could have. But we got a lot because we understood the PHYSICS of what was happening.
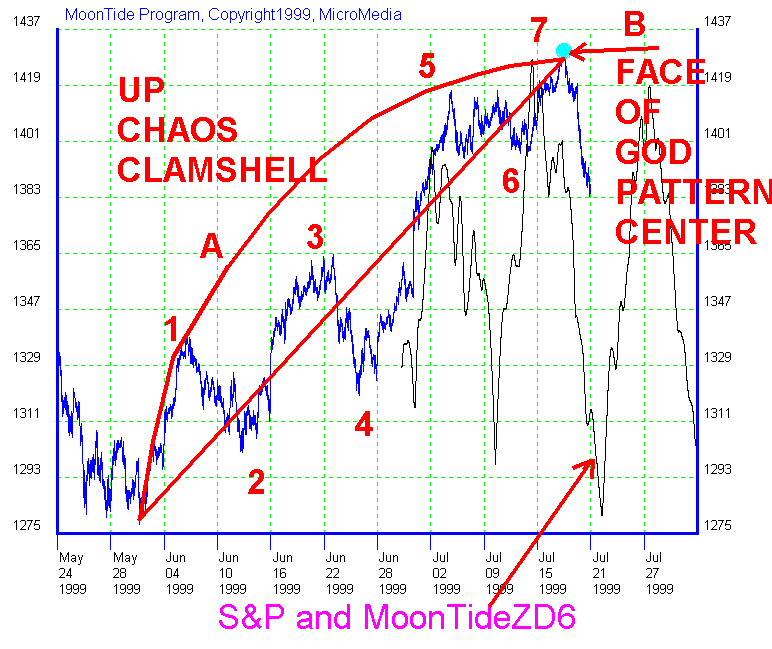
This is the chart that said the drop was HERE, NOW.

Graduates of the FOG course know how to find these centers. That task is now getting easier as I have added the FOG pattern to both my daily CHAOS TRADER software and the MoonTide software. That development work is beginning to pay off.
The chart also shows the MTZD6 smoothed MoonTide. It called for a drop into today, July 22nd. That gave a good clue that the vertical move at the FOG center was DOWN, which gave us the confidence to double up on our short. Of course, we let the market prove us right by simply placing a sell stop below the market. The FOG and the Tides and the Chaos Clamshell all fit together, and we had a good trade. That's how knowledge, hard work, and patience can pay off.
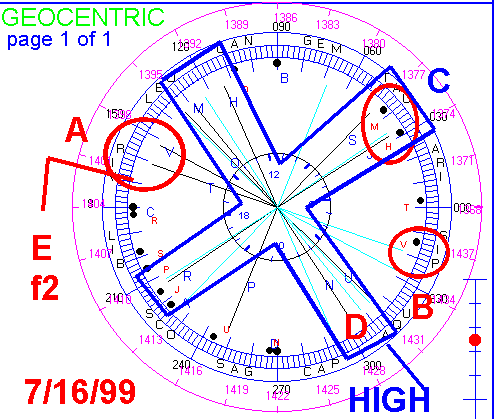
Now, for a little "physics from the ephemeris." The chart below shows the geocentric wheel last Friday.

The Exchange rotated past Venus and the NEW MOON "leaving the market" right near the close on Friday, shown at A. Prices topped out at the Neptune leg ot the blue Grand Cross at B. The Rising Sign is at C. Mercury was on one leg of the Grand Cross. But note that Venus and the moon were just about half way between the legs of the Grand Cross. That set up an 8th harmomic action, doubling the 4th harmonic of the Grand Cross. In Chaos Theory, frequency doubling is a PRECURSOR TO CHAOS.
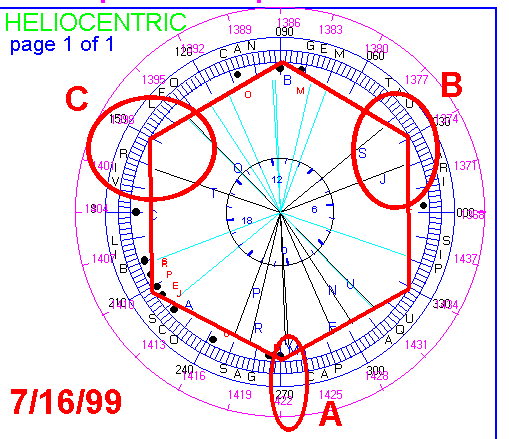
This separation between geocentric Venus and Mercury, freshly transitted by the moon, was very important. Why? Look at this heliocentric chart.

At A, Mercury and Venus were conjunct at the bottom of the wheel. At B is the Rising Sign. At C is the corner set by the Exchange and the Moon at the close on Friday. I have written before about the two positions of the S&P hexagon. The position here is the UNSTABLE position. It is often found just before a vertical move.
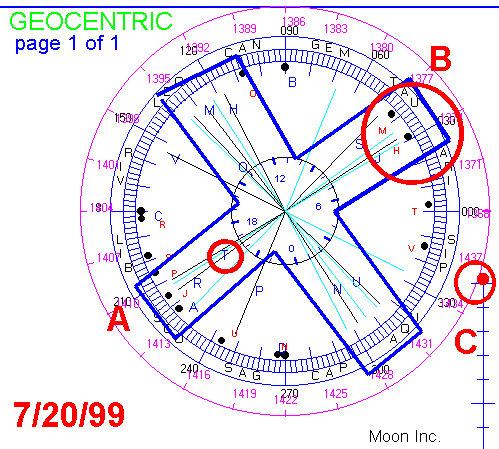
Things got really wild on Tuesday. The chart below shows why.

See how perfectly the Grand Cross is formed? The Moon at A is conjoining Mars, opposing the Rising sign at B. And the Moon was at max inclination (C), giving it maximum effect. One could almost "hear the bell ringing."
Trading is never easy. The markets are very complex, confusing, and chaotic. But every now and then, with the right tools, with the right knowledge, and with the right mindset, one can CASH IN ON CHAOS.