
Sep 23, 1999
This is a key point in the annual cycle of nearly all markets. And with this year's Grand Cross making the fourth harmonic of any cycle very strong, it is not surprising that the equinox is showing up as a key cycle point - all over the place.
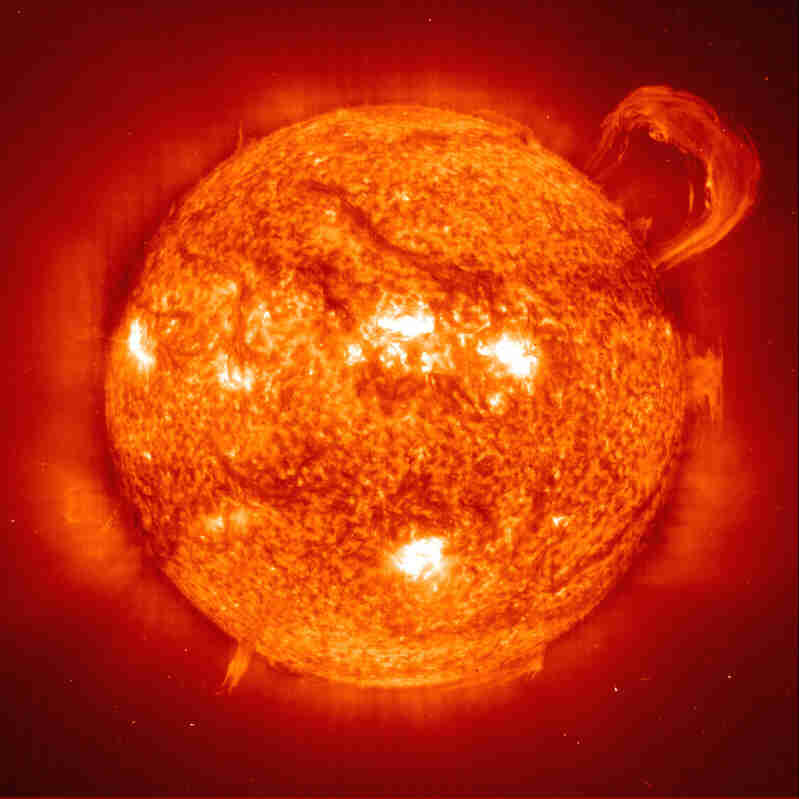
This great photo of the sun was today's Astronomy Picture of the Day (from http://antwrp.gsfc.nasa.gov/apod/astropix.html).
It comes with this explanation:
Today, the Sun crosses the celestial equator and seasons change from Summer to Fall in the north and Winter to Spring in the southern hemisphere. Defined by the Sun's position in sky the event is known as an equinox - the length of daylight is equal to the length of night. Just last week the active Sun produced the dramatic eruptive prominence seen in this extreme ultraviolet picture from the space-based SOHO observatory. The hot plasma is lofted above the solar surface by twisting magnetic fields. How big is the prominence? Click on the image to view the larger full-sun picture. At the same scale, planet Earth would likely still appear smaller than your cursor.

If you've studied my work, you know that it has shown that the planets stir up the sun, that changes the energy flow to earth, the variations in ions reaching the earth vary the voltage on our ionosphere, and thus vary the emotional currents flowing through us, which shows up as emotional buying or selling in the market.
Today was a perfect example. For several weeks I have been tracking a chaotic Strange Attractor/Strange Repellor SA/SR associated with the Equinox. I track them using my Face of God pattern. This pattern is posted in the secure Fogger's Room.
I had the SA/SR centered at noon today, at and S&P 500 futures price of 1332. I set up today's One-A-Day trade to "go with the flow" at 1:00 Eastern, which is when the Exchange rotated past the Sun.
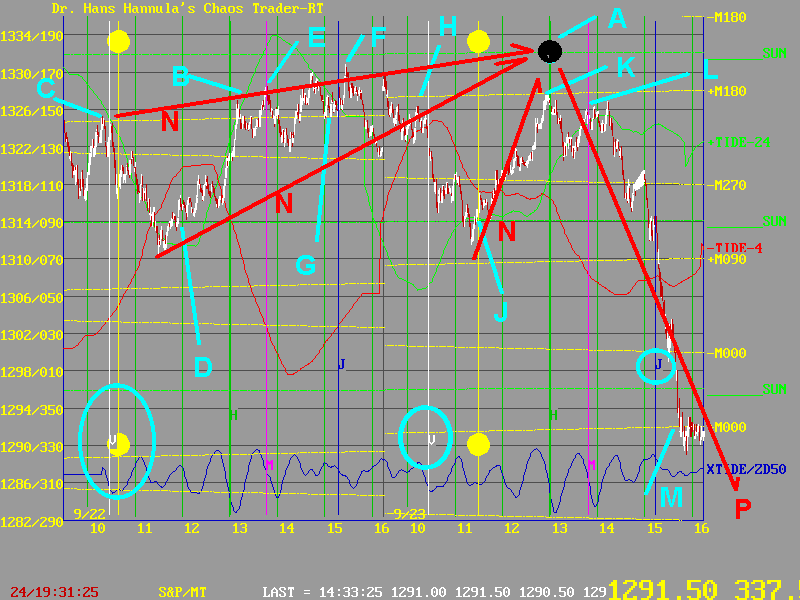
Here's the S&P chart for yesterday and today.

The green line at B is the MoonTide forecast. It forecast the market prettry well over these two days -DOWN-UP-DOWN-UP-DOWN.
At C, the market peaked as the Exchange passed Venus and the Full Moon. Remember the Moon and Venus Rising Sign two weeks ago? This is it's effect two weeks later.
At D, prices rallied of the Sun electric field flux line that is 90 degrees from the SA/SR. This is Gann's squaring of price and time. Prices peaked at E on Mercury, and at F just after Jupiter. They found support at the +M180 FULL MOON flux line at G.
Today, prices opened near that line, sagged, then dropped sharply as the Exchange passed Venus. They fell inot the FULL MOON at J, where they found support on the Sun flux line. Again, prices were square time.
They rallied to 1:00, right EXACTLY to the +M180 FULL MOON flus line. What was support yesterday was now resistance. And the SA/SR, which had been attracticn price, now became a Strange Repellor.
Our One-A-Day made a great entry, but we were stopped out when prices peaked on Mercury. But for a gain, so that's not bad for a blind mechanical trade. We win over time.
After passing Mercury, prices dropped 36 points, for a 180 degree swing, and a "Double Bandgap Energy Jump." It was over when prices reached the +M000 flux line at M.
See how the prices were attracted along lines N and then repelled along line P. That's how SA/SRs work. That's chaos theory in action.
Note that prices "streaked through" the point where the exchange passed Jupiter. This tells us to look into the future to see what Jupiter is doing.
Jupiter is approaching Saturn. On Monday the 27th, about two hours after sunset, you will be able to see another SIGN IN THE SKY. Look for it, as the Full Moon conjoins Jupiter and Saturn. Remember that big prominence on the Sun? It is positioned at the same position on the cirle as Saturn and Jupiter. That is not coincidental. And neither was the large quake in Taiwan. These are big, strong cycles at work.
What this all tells us is that today's action is strong physical evidence that the market is following a seasonal cycle that has turned down. That's good, because we are sitting short on our position trading hotline.