Cashing In On Natural Energy
Dr. Hans Hannula, PhD, RSA, CTA

Dr. Hans Hannula, PhD, RSA, CTA
In my work on market behavior, I have developed the theory that market prices over time represent the present state of an energy field. Recent work has resulted in the ability to compute a measure of the energy coming into a market. This computation is based only on knowledge of the market's first trade date, and time.
If this sounds a bit like financial astrology, it isn't. It goes far beyond. My work has recognized that the centuries old observations of astrologers represent a body of folklore which must have a scientific basis. As a scientist and systems engineer, I have spent the better part of the past 25 years making observations of markets, developing theories about what physical processes are operating to move price, creating mathematical models based on those theories, and writing computer programs to simulate markets. In a nutshell, I try to scientifically discover what lies beneath the folklore of financial astrology.
It's like chicken soup. Mothers for centuries have known that when a child had a cold, it was helpful to feed them chicken soup. Finally, a PhD student, probably desperate for a thesis topic, studied the vapors given off by the chicken soup. He found that they contain chemicals very similar to the ones in the nasal decongestants sold by drug companies. Seems mother was right. She just didn't know why.
Folklore is the raw material of science. Natural energy drives markets. It does have a scientific basis.
Why do markets do what they do, then? Basically, they respond to energy from the universe according to how they were built. It turns out that the information about how a market is built is contained in the date of first trade, but not in the way understood by astrologers. We have been able to extract the underlying scientific principles, model them, and produce a program that computes an XGO function. The name XGO implies that market X will GO in the direction of the function. XGO is a measure of the natural energy coming into a market.
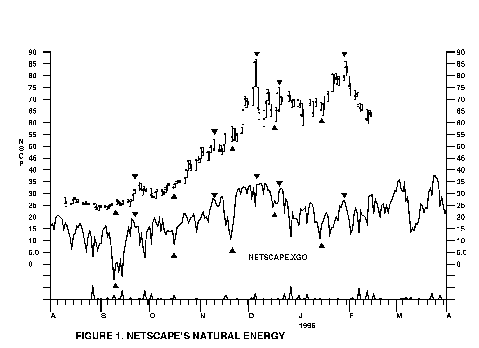
So how well does XGO work? Look at Figure 1. It shows Netscape stock and Netscape.XGO. Notice two things in particular. First, the detail of XGO matches the detail of price movement. There are as many small swings in price as there are in XGO.

Second, notice the correctness of the direction. When XGO goes up, the price tend to go up. When it goes down, the price tends to go down.
There are times XGO leads prices on a major turn. XGO will make a minor low, and prices will make a low then, but a lower low on the next XGO minor low, which is higher. Conversely for highs.
This happens because XGO is the energy coming into that market, which also has its internal momentum. It may take more energy to turn the market. We have found the Hannula Market Fractal pattern taught in the Cash In On Chaos course effective in identifying which XGO turn will be strong enough to turn the market.
So while XGO is not a perfect forecast for markets, it is a very good tool, especially for timing. It surpasses anything I have seen or done to date, including some very good neural networks.
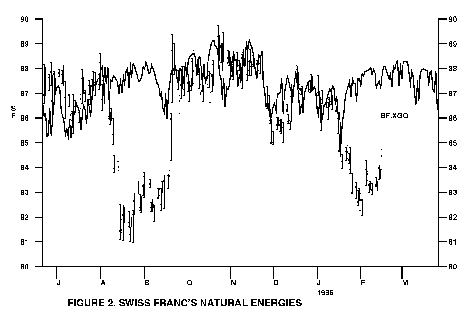
Now look at Figure 2. This shows the Swiss Franc and its XGO. Notice first that the prices follow XGO very closely much of the time. Notice then that at other times, prices fall or rise sharply in a chaotic move. However, after this chaotic move, prices again follow XGO. What has happened here is that the market has made an internal "chaotic state transition", a quantum leap if you will.

This chart shows the true chaotic nature of markets. They spend much of their time smoothly responding to the XGO energy inputs. During those periods, the correlation coefficient, a measure of fit, can exceed .9 (1.0 is perfect). Then at key times, these inputs trigger a chaotic state transition. We have made significant progress on identifying the points in time when these events can occur. That is also taught in our Cash In On Chaos course.
If markets have XGO functions, what about people? Astrology says they should. Indeed, they do. In fact, one of the things that led to the discovery of XGO was noting the changes in my own energy level over time.
Everyone knows, "Some days are diamonds, some days are coal," to quote singer John Denver. Indeed the XGO function for a person gives a quick view of a personality. Figure 3 shows A, who is a steady, stable doctor, and B, who is an up and down, excitable broker (B's function is plotted 40 points low for clarity). Notice that B has much larger energy swings than A.

We think of these "mood swings" as emotional and internal. XGO shows that they are more accurately our response to the changing energy fields of the universe. Those emotions we feel are largely electrical currents from our environment. We really respond according to how we were built. Experience has shown that XGO does a pretty good job of forecasting one's joy/gloom curve. Because of that it has many uses, from picking good dates for important events, to trading.
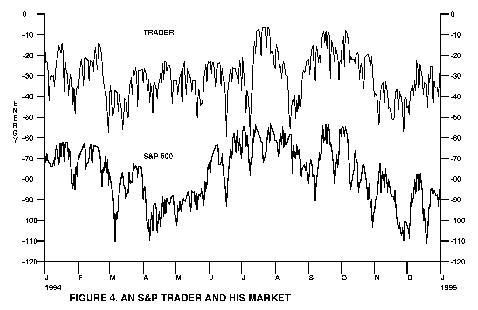
Folklore also says, "Birds of a feather flock together." I have often noticed that traders of the same personality tended to trade the same thing, especially pit traders. S&P traders are very different from bond traders, currency traders, etc. So when I got a call from an S&P daytrader telling me trading was exhausting him, I decided to compare his XGO with that of the S&P. Figure 4 shows the two. Notice how very similar they are! It is obvious that this trader was attracted to the S&P because it "felt" just like himself. His natural cycles tuned into the S&P's energy. In system theory, this is called "cycle entrainment". The two energy systems fall into lock step, and exchange a great deal of energy. For a trader, this can lead to entrapment.

We have observed three consequences of this sort of "mutual coupling." First, the attraction takes on the nature of a passionate love affair. Second, a trader coupled like this tends to see tops easier than bottoms. That's because when that market is bottoming, the trader is emotionally down. Third, such a trader runs a high risk of becoming "over-coupled" to the market. As they trade, they share the energy swings with that market. Doing so can cause extreme exhaustion, poor judgment, and just bad trading. So the magnetic attraction can become a fatal attraction. A trader will start trading badly, know it, but not be able to stop themselves. It is no wonder markets like the S&P chew traders up!
XGO then serves as a tool not only for forecasting market turns, but for monitoring a trader as well. On personal down days, the trader should not trade. If a trader becomes over-coupled, a vacation or a change in trading plan is needed.
One approach we have found successful is to use a One-A-Day approach to trading. The trader takes a signal during a small time window, makes the trade, and is done for the day. This "sampled data" approach creates "loose coupling" between the trader and the market. Figure 5 shows the result of using this approach in the S&P.

Another approach is to have the "tuned in" trader design the trading system to be used, and to delegate the execution of the trade to someone who is not "tightly coupled" to that market.
XGO functions for stocks, IBM, gold, Tbonds, wheat, Swiss Franc, and the Nikkei are carried monthly in the Cash In On Chaos Newsletter. Individual S&P 500 stock and other futures market XGO functions can be ordered for $36 per year. Other stocks can be done if you provide the date of first trade or date of incorporation.
XGO is one component in a growing set of market tools under development at MicroMedia. One can learn more by contacting the author or checking out his WEB site at http://www.cashinonchaos.com/hans. For your own XGO chart for one year, send $36 and your date of birth to MicroMedia, Box 33071, Northglenn CO 80241, or fax to 303 457 9871