![]()
![]()
**************************************************************************************
Energy Patterns in Tesla
Chaos Clinic for 7/22/2022
***************************************************************************************
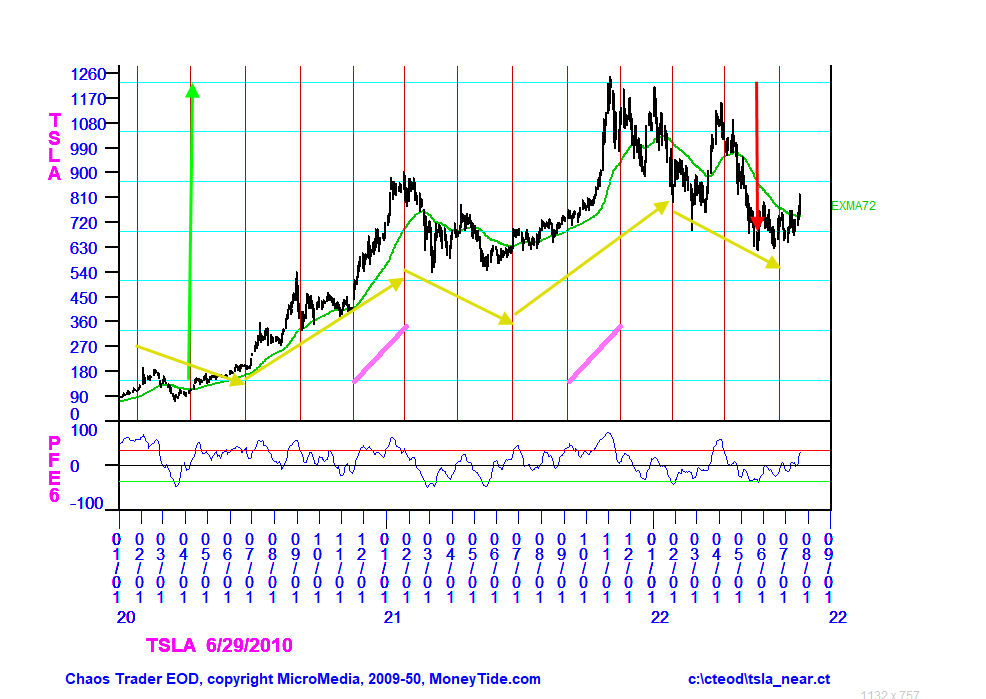
This chart is a daily chart of TSLA stock. It is plotted over a natural price and time
grid. This grid gives time points and price levels that TSLA naturally responds to.
Prices tend to move in integer multiples of the grid. The rally shown went up six units.
This is shown by the green arrow. The decline was down three units. shown by the red arrow.
The vertical lines are natural time lines repeated every one fifth of a year. TSLA has
a natal pentagon anchored by Venus, the Node, Jupiter, and Uranus. Two sides of this
penatagon are bisected by Sun on one side, and Moon on another. This gives TSLA the ability
to frequency doubling, crating chaotic moves.
Two such chaotic moves are marked by the diagonal purple lines marked on the chart.
During these two periods the 72 day EXMA rose sharply.
Also sketched on the chart is a pattern shown by gold lines. It is down two periods,
up three periods.
Finally, at the bottom of the chart is a Polarized Fractal Efficiency indicator.
I invented this indicator and published it in Stocks and Commodities under the pen
name Hans Hannula. You can download a copy of that article
HERE
To learn more about Chaos Clamshells, I suggest my Cash In On Chaos course,
available at Moneytide.com
7/22/2022 12:28:01 PM MT awe:: thank you Dr Al - most appreciated - great weekend to you and yours.
7/22/2022 12:20:22 PM MT Al****:: I'm going to call it a day for the Chaos Clinic-thanks for coming-have a good weekend- see you next week
7/22/2022 12:17:09 PM MT Al****:: steady down - boring but profitable
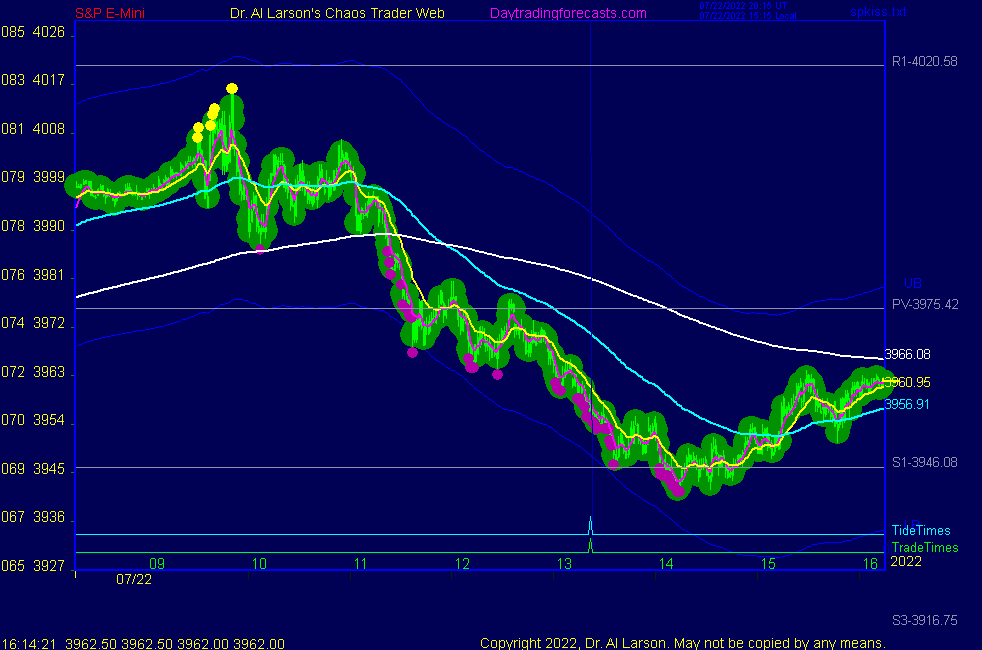
7/22/2022 11:38:43 AM MT Al****:: note on the Secret ->esnat72 and others the bars are colored by the 36 minute EXMA crossing the 220 minute
this is a good tool for staying in a trade
7/22/2022 11:35:35 AM MT Al****:: on the Chaos Clinic chart have been down on red -Tide, which now
turns up, but an inversion to the green +Tide means down rest of day -tracking EXMAs say the inversion has occurred
7/22/2022 10:21:21 AM MT Al****:: note on the SPSunMoon chart the high being repelled by the down -T225 Moon electric field flux line - it is also shown on the
SPKISS page chart 5
7/22/2022 10:12:39 AM MT Al****:: note on chart 7 on the SPKISS page that the high today was on the cyan center line of the cycle ribbon, which has turned down
7/22/2022 10:07:04 AM MT Al****:: this looks to be the end of an 8 calendar day fractal up from 7/14
as shown on Chart 5 on the SPKISS page
7/22/2022 9:55:17 AM MT Al****:: also note on the SPSunMooon page that the rollover came when
the rotating exchange passed Venus - the V000 vertical cyan line
7/22/2022 9:52:31 AM MT Al****:: note chart 3 on SPKISS page showing the rollover of the 440 minute EXMA
7/22/2022 7:14:26 AM MT Al****:: Good Morning visitors. Welcome to the Chaos Clinic.
The written Chaos Clinic is on the AUX page.
This site has a lot of charts,
so you may find it useful to have several of them available within your
browser. If you have a tabbed browser, you can open separate charts
in separate tabs by right clicking on any link, and selecting "open in new tab"
from the menu. The main list of site pages is at
http://daytradingforecasts.com/chartlistsec.asp
Recommended pages to watch are SPKISS, MTRainbow, and Chat.
For astro stuff, add SPSunMoon, Wheel, and Chaos Clinic.
A special set of Dr. Al's research charts are on the Secret page.
Comments in the chat room are announced by a
"duck call" noise. This noise also occurs when the software detects a
resonant hex pattern on the Wheel page. MoonTide trading tutorials
are on the right side of the ListOfCharts page. One should
read Trading the MoonTide Tutorial and Keep it Simple as a minimum.
Many subscribers do not strictly trade the MoonTides, but use the charts on this
site as input to their own trading strategies. For example, charts 5 and 6 on the
SPKiss page are a good starting point for swing traders.
Also on this site is the Certified Chaos Trader's Room. That room is open
to graduates of my 4 main courses. See http://moneytide.com -> Courses for details.
9:00 Eastern-System: No comments
![]()
![]()